Pipeline of Continuous Integration(CI) for containers has several basic steps. Lets see what they are:
Setup a trigger
Listen to a change in repositories(github, bitbucket) such like pull request, new tag or new branch.
It is basic step for any CI/CD tool and for google cloud builder it is pretty trivial task to setup. Check out Container Registry – Build Triggers tool in google cloud console.
Build an image
When change to repository occur we want to start build of new Docker container image for a change. Good practice is to tag new image with branch name and git reference hash. E.g. master-00covfefe
With cloud builder you face two choices: use a Dockerfile or cloudbuild.yaml file. With Dockerfile option steps are predetermined and don’t give you too much flexibility.
With cloudbuild.yaml you can customise every step of your pipeline.
In the following example first command is doing a build step using Dockerfile and second command tag new image with branch-revision pattern(remember master-00covfefe):
steps:
- name: 'gcr.io/cloud-builders/docker'
  args: [ 'build', '-t', 'eu.gcr.io/$PROJECT_ID/my-nodejs-app', '.' ]

- name: 'gcr.io/cloud-builders/docker'
  args: [ 'tag', 'eu.gcr.io/$PROJECT_ID/my-nodejs-app', 'eu.gcr.io/$PROJECT_ID/my-nodejs-app:$BRANCH_NAME-$REVISION_ID']
Push new image to Container Registry
One important note that cloudbuild.yaml file has special directive “image” which publish image to registry, but that directive only executed at the end of all steps. So, in order to perform deployment step you need to publish image as a separate step.
- name: 'gcr.io/cloud-builders/docker'
  args: ['push', 'eu.gcr.io/$PROJECT_ID/my-nodejs-app:$BRANCH_NAME-$REVISION_ID']
Deploy new image to Kubernetes
When new image is in registry it’s time to trigger deployment step. In this example it is deployment to Kubernetes cluster.
This step require Google Cloud Builder user to have Edit permissions to kubernetes cluster. In google cloud it is a user with “@cloudbuild.gserviceaccount.com” domain. You need to give that user Edit access to kubernetes using IAM console.
Second requirement is to specify zone and cluster cloudbuild.yaml using env variables. That will tell kubectl command to which cluster to deploy.
- name: 'gcr.io/cloud-builders/kubectl'
  args: ['set', 'image', 'deployment/my-nodejs-app-deployment', 'my-nodejs-app=eu.gcr.io/$PROJECT_ID/my-nodejs-app:$BRANCH_NAME-$REVISION_ID']
  env:
  - 'CLOUDSDK_COMPUTE_ZONE=europe-west1-d'
  - 'CLOUDSDK_CONTAINER_CLUSTER=staging-cluster'
What next
At this point the CI/CD job is done. Possible next steps to improve your pipeline can be:
- Send notification to Slack or Hipchat to let everyone know about new version deployment.
- Run user acceptance tests to check that all functions perform well.
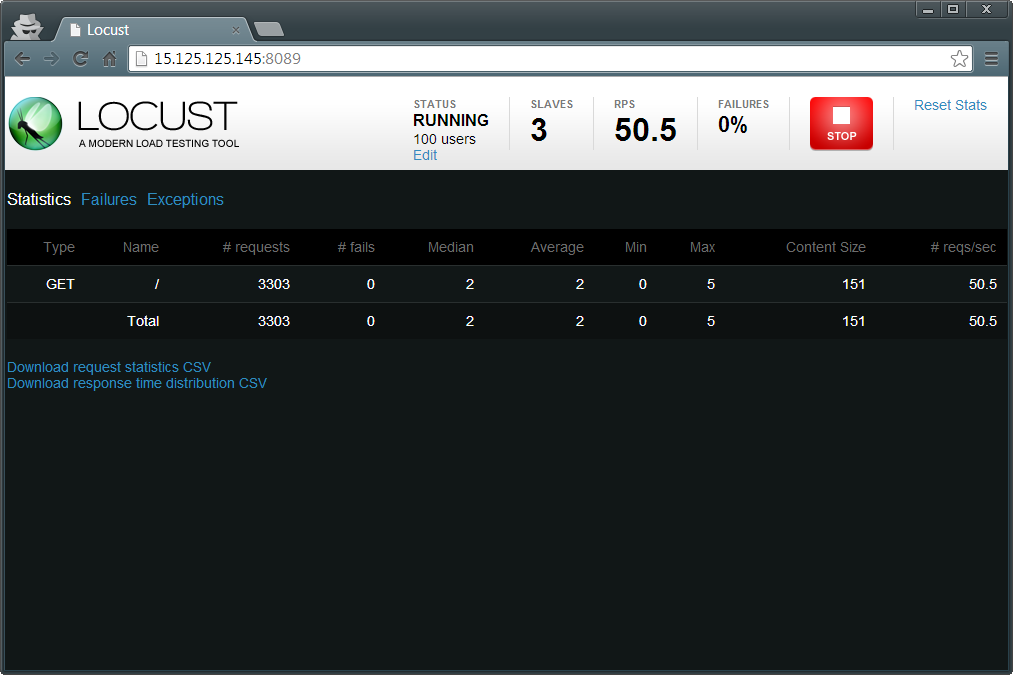
- Run load tests and stress tests to check that new version has no degradation in performance.
Full cloudbuild.yaml file example
steps:
#build steps
- name: 'gcr.io/cloud-builders/docker'
  args: [ 'build', '-t', 'eu.gcr.io/$PROJECT_ID/my-nodejs-app', '.' ]

- name: 'gcr.io/cloud-builders/docker'
  args: [ 'tag', 'eu.gcr.io/$PROJECT_ID/my-nodejs-app', 'eu.gcr.io/$PROJECT_ID/my-nodejs-app:$BRANCH_NAME-$REVISION_ID']

- name: 'gcr.io/cloud-builders/docker'
  args: ['push', 'eu.gcr.io/$PROJECT_ID/my-nodejs-app:$BRANCH_NAME-$REVISION_ID']

#deployment step
- name: 'gcr.io/cloud-builders/kubectl'
  args: ['set', 'image', 'deployment/my-nodejs-app-deployment', 'my-nodejs-app=eu.gcr.io/$PROJECT_ID/my-nodejs-app:$BRANCH_NAME-$REVISION_ID']
  env:
  - 'CLOUDSDK_COMPUTE_ZONE=europe-west1-d'
  - 'CLOUDSDK_CONTAINER_CLUSTER=staging-cluster'

#image update steps(two tags: latest and branch-revision)
images:
- 'eu.gcr.io/$PROJECT_ID/my-nodejs-app'
- 'eu.gcr.io/$PROJECT_ID/my-nodejs-app:$BRANCH_NAME-$REVISION_ID'

#tags for container builder
tags:
  - "frontend"
  - "nodejs"
  - "dev-team-1"