I’m in the same boat as a lot of engineering teams right now: most of my code is agent-written, and there is no human capacity to review all of it line by line. That leaves two choices, and neither is a good choice:
- Wait for human review — and fall behind on delivery.
- Merge without review — and quietly lower the quality bar.
So at McMakler we picked a third option: stop reviewing the code, and start building the machine that reviews it for us. Back to the drawing board to design a CI/CD system that guarantees every change clears a minimum quality baseline — without a human reading every diff.
The baseline
Before automating anything, you have to decide what “good enough to merge” actually means. The conventions, guidelines, and review criteria below weren’t handed down — they were defined by the team, who codified what “good” means for our stack. The pipeline just enforces what we already agreed on. Ours:
- TDD as the default — every feature ships with unit tests, not “tests later.”
- A minimum coverage gate — ≥80% on new code, enforced in the pipeline.
- Automated AI code review against explicit conventions, checking for:
- architecture, structure and project guidelines
- security and adversarial analysis
- tests for intent, not just the lines
- Classic supply-chain hygiene — SBOM generation, dependency scanning, vulnerability scanning (semgrep, Trivy, and friends).
- The outer ring — E2E, accessibility, and performance testing.
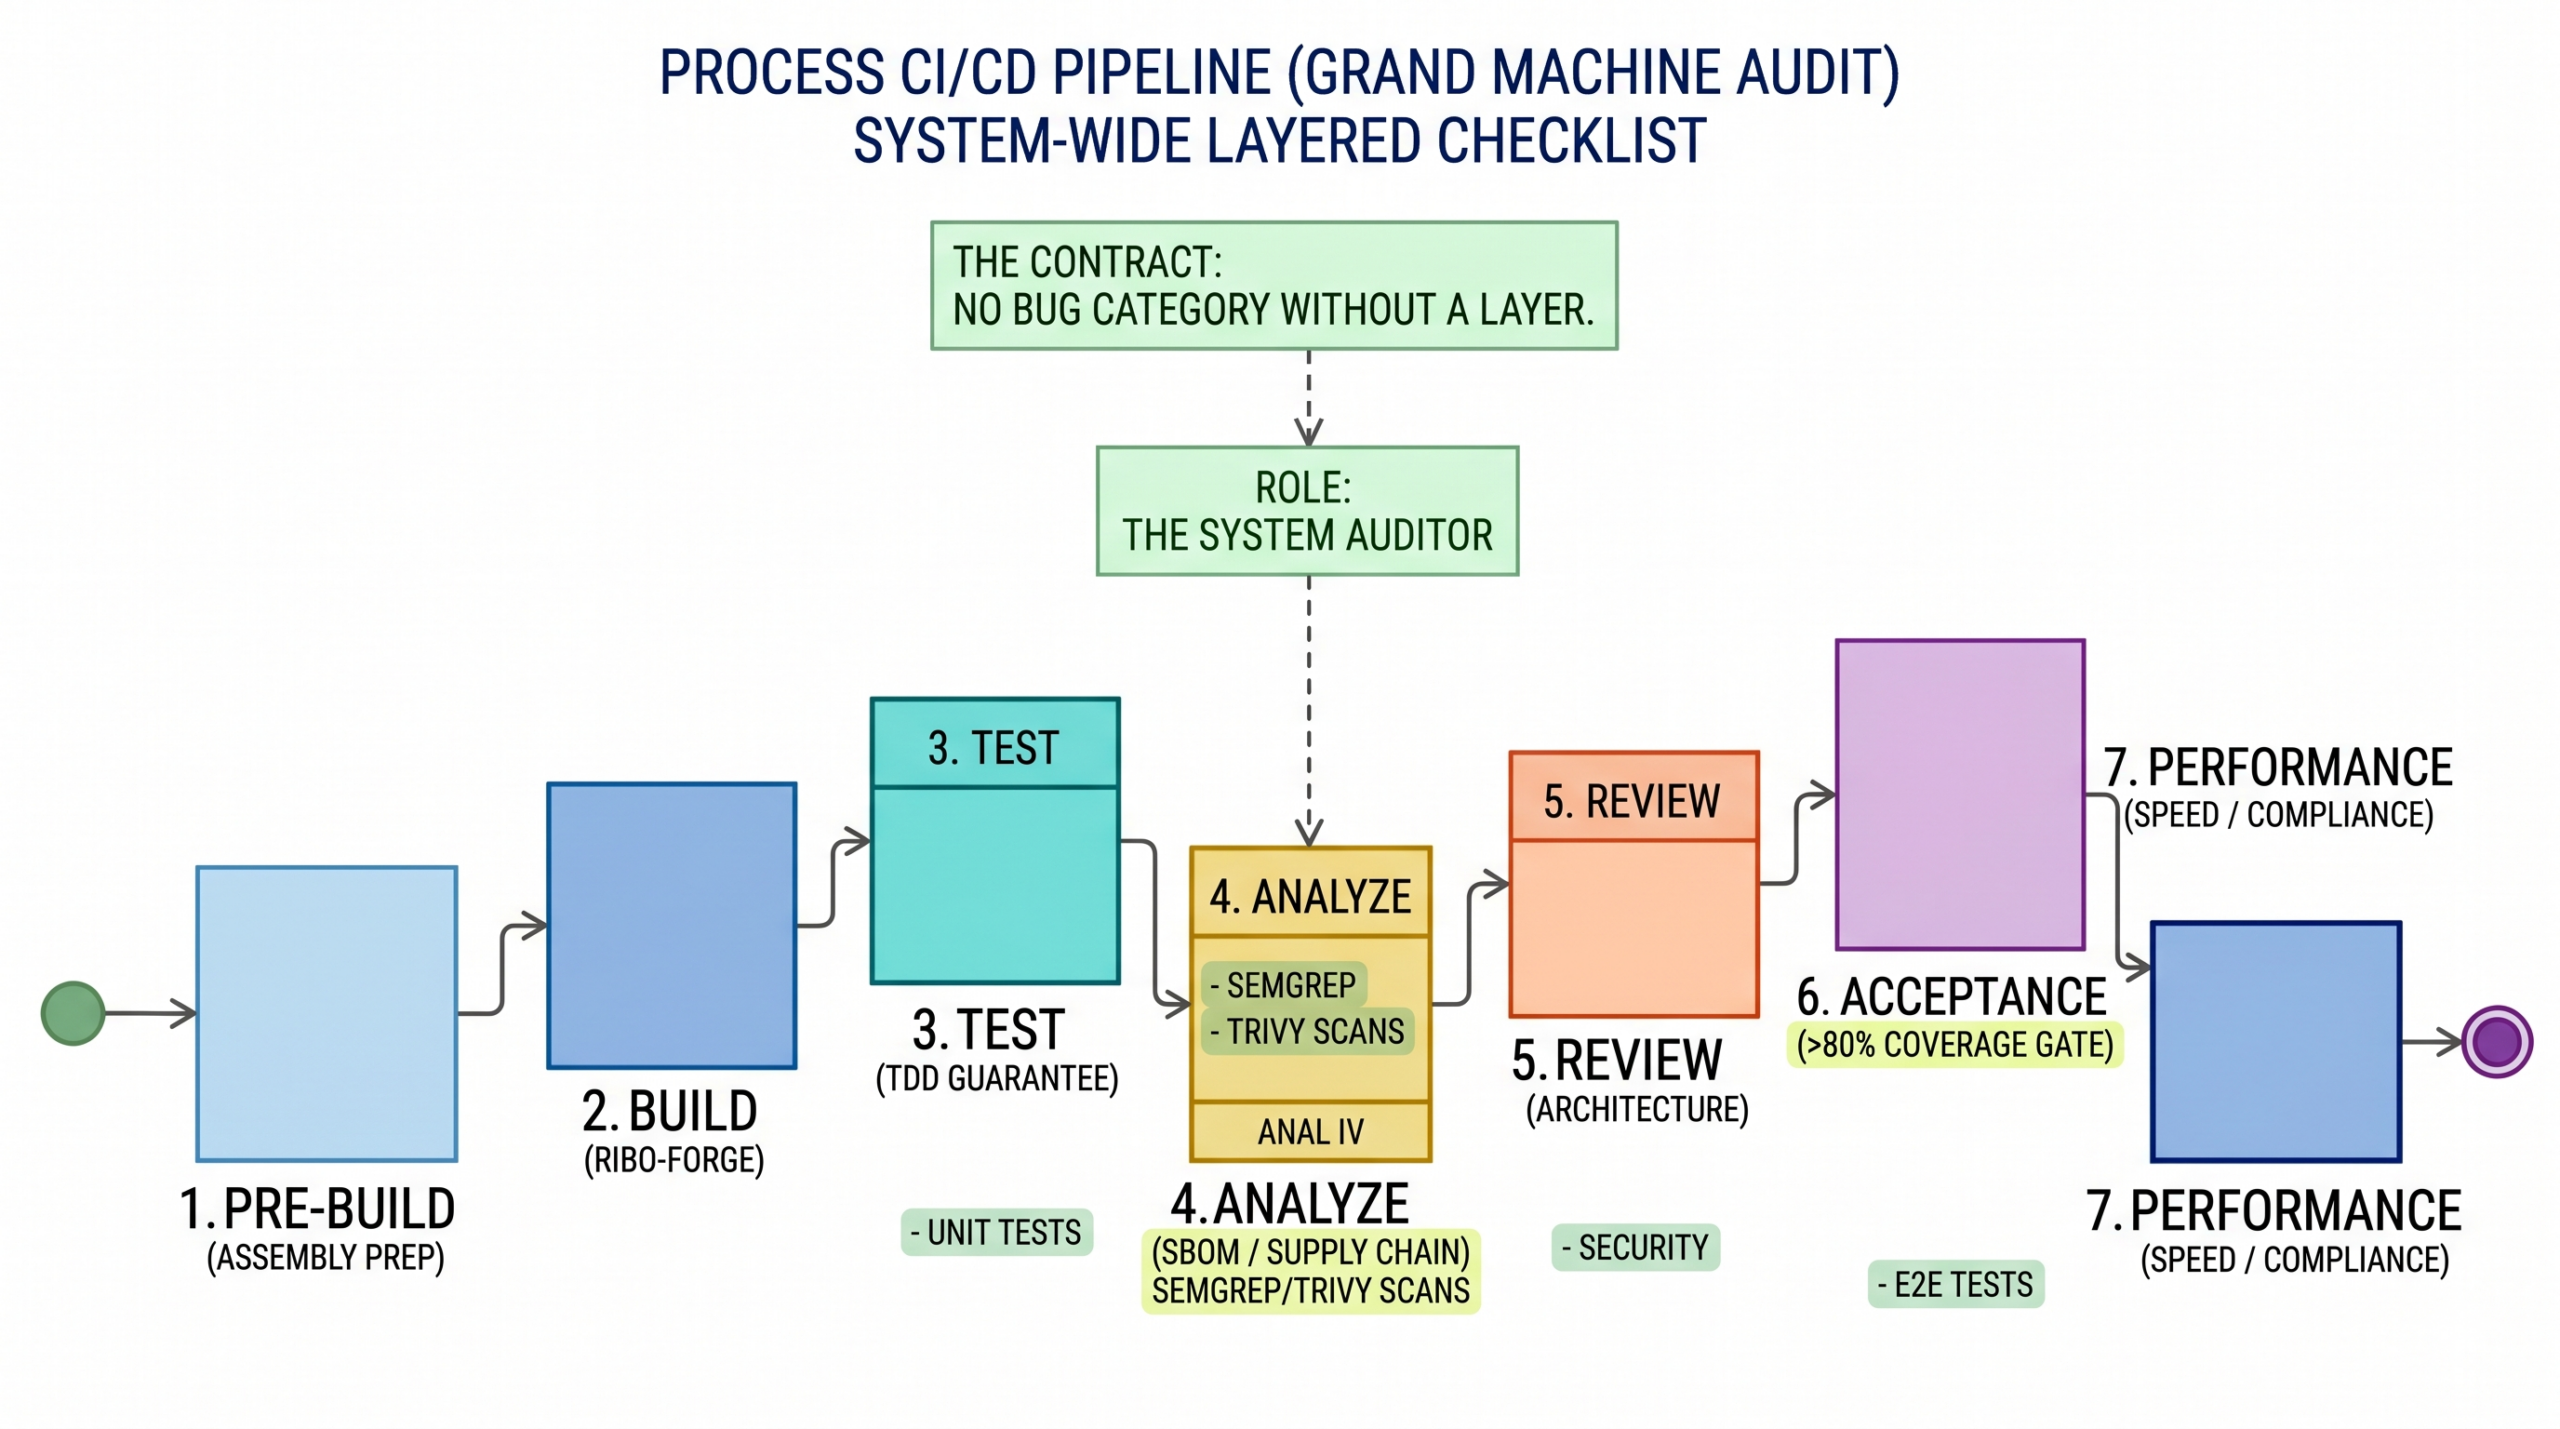
The trick is that none of these are optional and none of them blocks on a tired human. The contract I keep coming back to:
Every category of bug has a layer that catches it. No category without a layer. If something slips through, you harden the layer that missed it — you never bring back line-by-line review.
That’s it. That’s the whole philosophy. Each layer owns a class of bug; the layers together are the gate.
The pipeline
All of it runs on every merge request, in parallel where it can, in these stages:
static tests → build tests → ai review → acceptance → performanceTarget: the whole thing finishes in under 10 minutes.
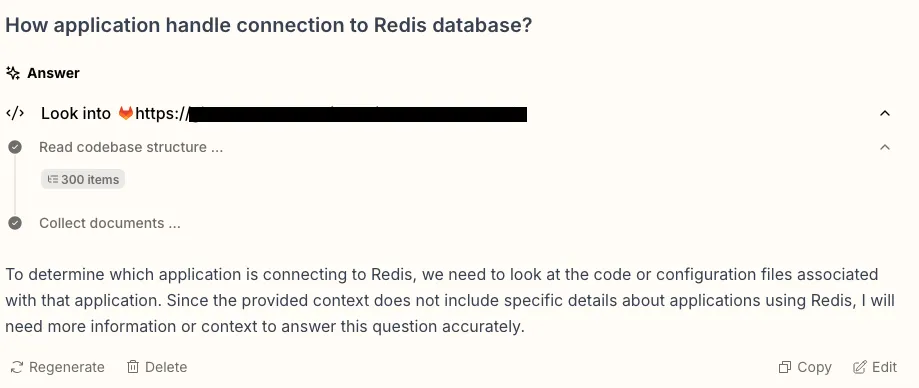
The AI-review stage deserves a note, because it’s the part people are skeptical about. It runs four reviews — architecture, security, test coverage, conventions (think CodeRabbit / Greptile or your own wrapped prompts). It surfaces findings to the human rather than hard-blocking the merge on every false positive. The decision still belongs to a person.
The results
We piloted this on a real codebase:
- ~60,000 lines of code
- 1,000+ unit tests
- 60+ E2E tests
- coverage above the line we set
- zero known-vulnerable packages
We traded many hours of manual code review for an automated suite. And the suite doesn’t get tired, doesn’t get exhausted, doesn’t skim the boring files at 6pm on a Friday. It just do it.
Where engineers are involved?
“Bulletproof” doesn’t mean “no humans.” It means we spend our judgement where it matters instead of rubber-stamping diffs.
- High-risk paths still get line-by-line SWE review — auth, payments, PII, schema migrations. By design, not by default. Line-by-line went from being the gate to being the exception.
- For everything else, the human does a ~15-minute pass: did the change do what the plan asked, are there any unresolved findings in the AI review summaries, does the architecture and file list look sane.
That’s the real shift. The reviewer’s job moved up a level — from reading code to auditing the machine that reads code.
Why I think this holds up?
This isn’t just my opinion. Simon Willison’s Vibe Engineering (Oct 2025) lands in the same place from a different direction: the practices that make AI-assisted engineering work are the practices senior engineers already value — automated testing, CI/CD, good version control, code-review culture. His framing is that AI amplifies existing expertise; it doesn’t replace it. A strong testing and review machine is exactly that expertise, encoded once and applied forever.
The compounding part is what makes me optimistic. When something does slip through, it becomes a new test, a new convention, a hardened layer — so the same bug can’t escape twice. The machine gets a little more bulletproof with every escape, and every team that imports it inherits the upgrade.