The Problem
Hybrid cloud is the future, but monitoring remains stuck in the past. Many organizations embrace hybrid infrastructure, yet struggle with fragmented observability tools. Why? Because monitoring providers still operate in silos.
One of the primary reasons hybrid monitoring isn’t as prevalent is the challenge of instrumentation. Many cloud providers offer their own monitoring solutions. Instrumentation libraries are often incompatible with one another, making cross-platform integration difficult.
The good news? With OpenTelemetry, Grafana, and Datadog, hybrid monitoring is becoming easier and more flexible. 🚀
The Solution
One promising development is the rise of open-source, vendor-neutral instrumentation frameworks like OpenTelemetry.
In essence, open standards are reducing incompatibility issues and allowing “a vendor-agnostic approach to get data from the sources you need to the observability service of your choice.”
A step toward solving the hybrid cloud monitoring challenge came when Grafana introduced the otelcol.receiver.datadog component.
Now, with otelcol.receiver.datadog, Grafana users can ingest and process Datadog telemetry directly within OpenTelemetry pipelines, unlocking several advantages:
- Expanding Grafana’s Reach to Datadog Customers
- Seamless Integration with OpenTelemetry Pipelines
- Avoiding Vendor Lock-in While Retaining Datadog’s Strengths
- Cost Optimization by Centralizing Hybrid Monitoring
How it works together?
Requirements
- Grafana – for web UI
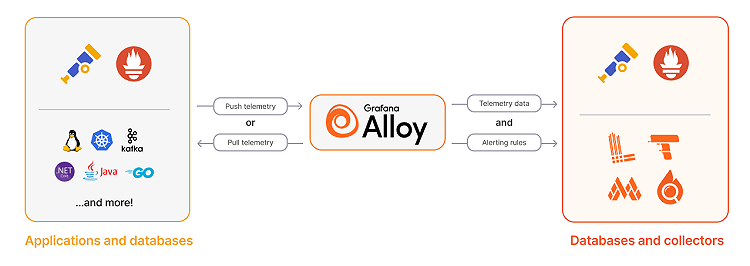
- Grafana Alloy – to receive, process and export telemetry data
- Grafana Tempo – to collect and visualize traces from Datadog instrumented apps
- Datadog agent – with enabled APM feature
- Instrumented application with Datadog trace library
Quick check list:
- you have running: Grafana, Alloy and Tempo services
- You have running Datadog agents
- You have instrumented applications with Datadog trace library
- You add Tempo as Datasource in Grafana
Grafana Alloy configuration
The core of the solution is to set up Datadog receiver in Alloy config:
receivers:
  datadog:
    endpoint: "0.0.0.0:9126"
    output:
      traces: [otelcol.exporter.otlp.tempo.input]

# I am skipping extra steps which you might want to use to pre-proces data

otelcol:
  exporter:
    otlp:
      tempo:
        client:
          endpoint: "https://tempo-distributor.example.com:443"
          tls:
            insecure: false
            insecure_skip_verify: true
To avoid ports conflict with Datadog agent we choose 9126 as a port for Alloy Datadog receiver.
Running Alloy as Daemonset with hostNetwork access allow agent to be present on each Node.
alloy:
  extraPorts:
    - name: "datadog"
      port: 9126
      targetPort: 9126
      protocol: "TCP"

controller:
  hostNetwork: true
  hostPID: true

service:
  internalTrafficPolicy: "Local"
Application set up
Application has to be configured to send APM traces to Node IP:1926.
The Node IP can be extracted form Kubernetes meta information and passed as environment variable:
env:
- name: NODE_IP
  valueFrom:
    fieldRef:
      fieldPath: status.hostIP
Datadog Agent configuration
With Datadog Agent we have two options:
- Send traces to Alloy Datadog receiver as addition to Datadog host
- Send traces only to Alloy Datadog receiver
With option 1 we assume you are using both Datadog and Grafana solutions in hybrid mode. In that case Datadog agent has to have following configuration:
agents:
  containers:
    agent:
      env:
        - name: DD_ADDITIONAL_ENDPOINTS
          value: '{"http://alloy-service:9126": ["datadog-receiver"]}'
        - name: DD_APM_ADDITIONAL_ENDPOINTS
          value: '{"http://alloy-service:9126": ["datadog-receiver"]}'
    traceAgent:
      enabled: true
      env:
        - name: DD_ADDITIONAL_ENDPOINTS
          value: '{"http://alloy-service:9126": ["datadog-receiver"]}'
        - name: DD_APM_ADDITIONAL_ENDPOINTS
          value: '{"http://alloy-service:9126": ["datadog-receiver"]}'
For option 2 where traces must go only to Alloy Datadog receiver following configuration might work:
datadog:
  apm:
    socketEnabled: true                    # Use the Unix Domain Socket (default). Can be true even if port is enabled.
    portEnabled: true                      # Enable TCP port 8126 for traces.
    useLocalService: false

  env:
    - name: DD_APM_DD_URL
      value: "http://alloy-service:9126"  # URL for OTel collector’s Datadog trace receiver
    - name: DD_APM_NON_LOCAL_TRAFFIC
      value: "true"
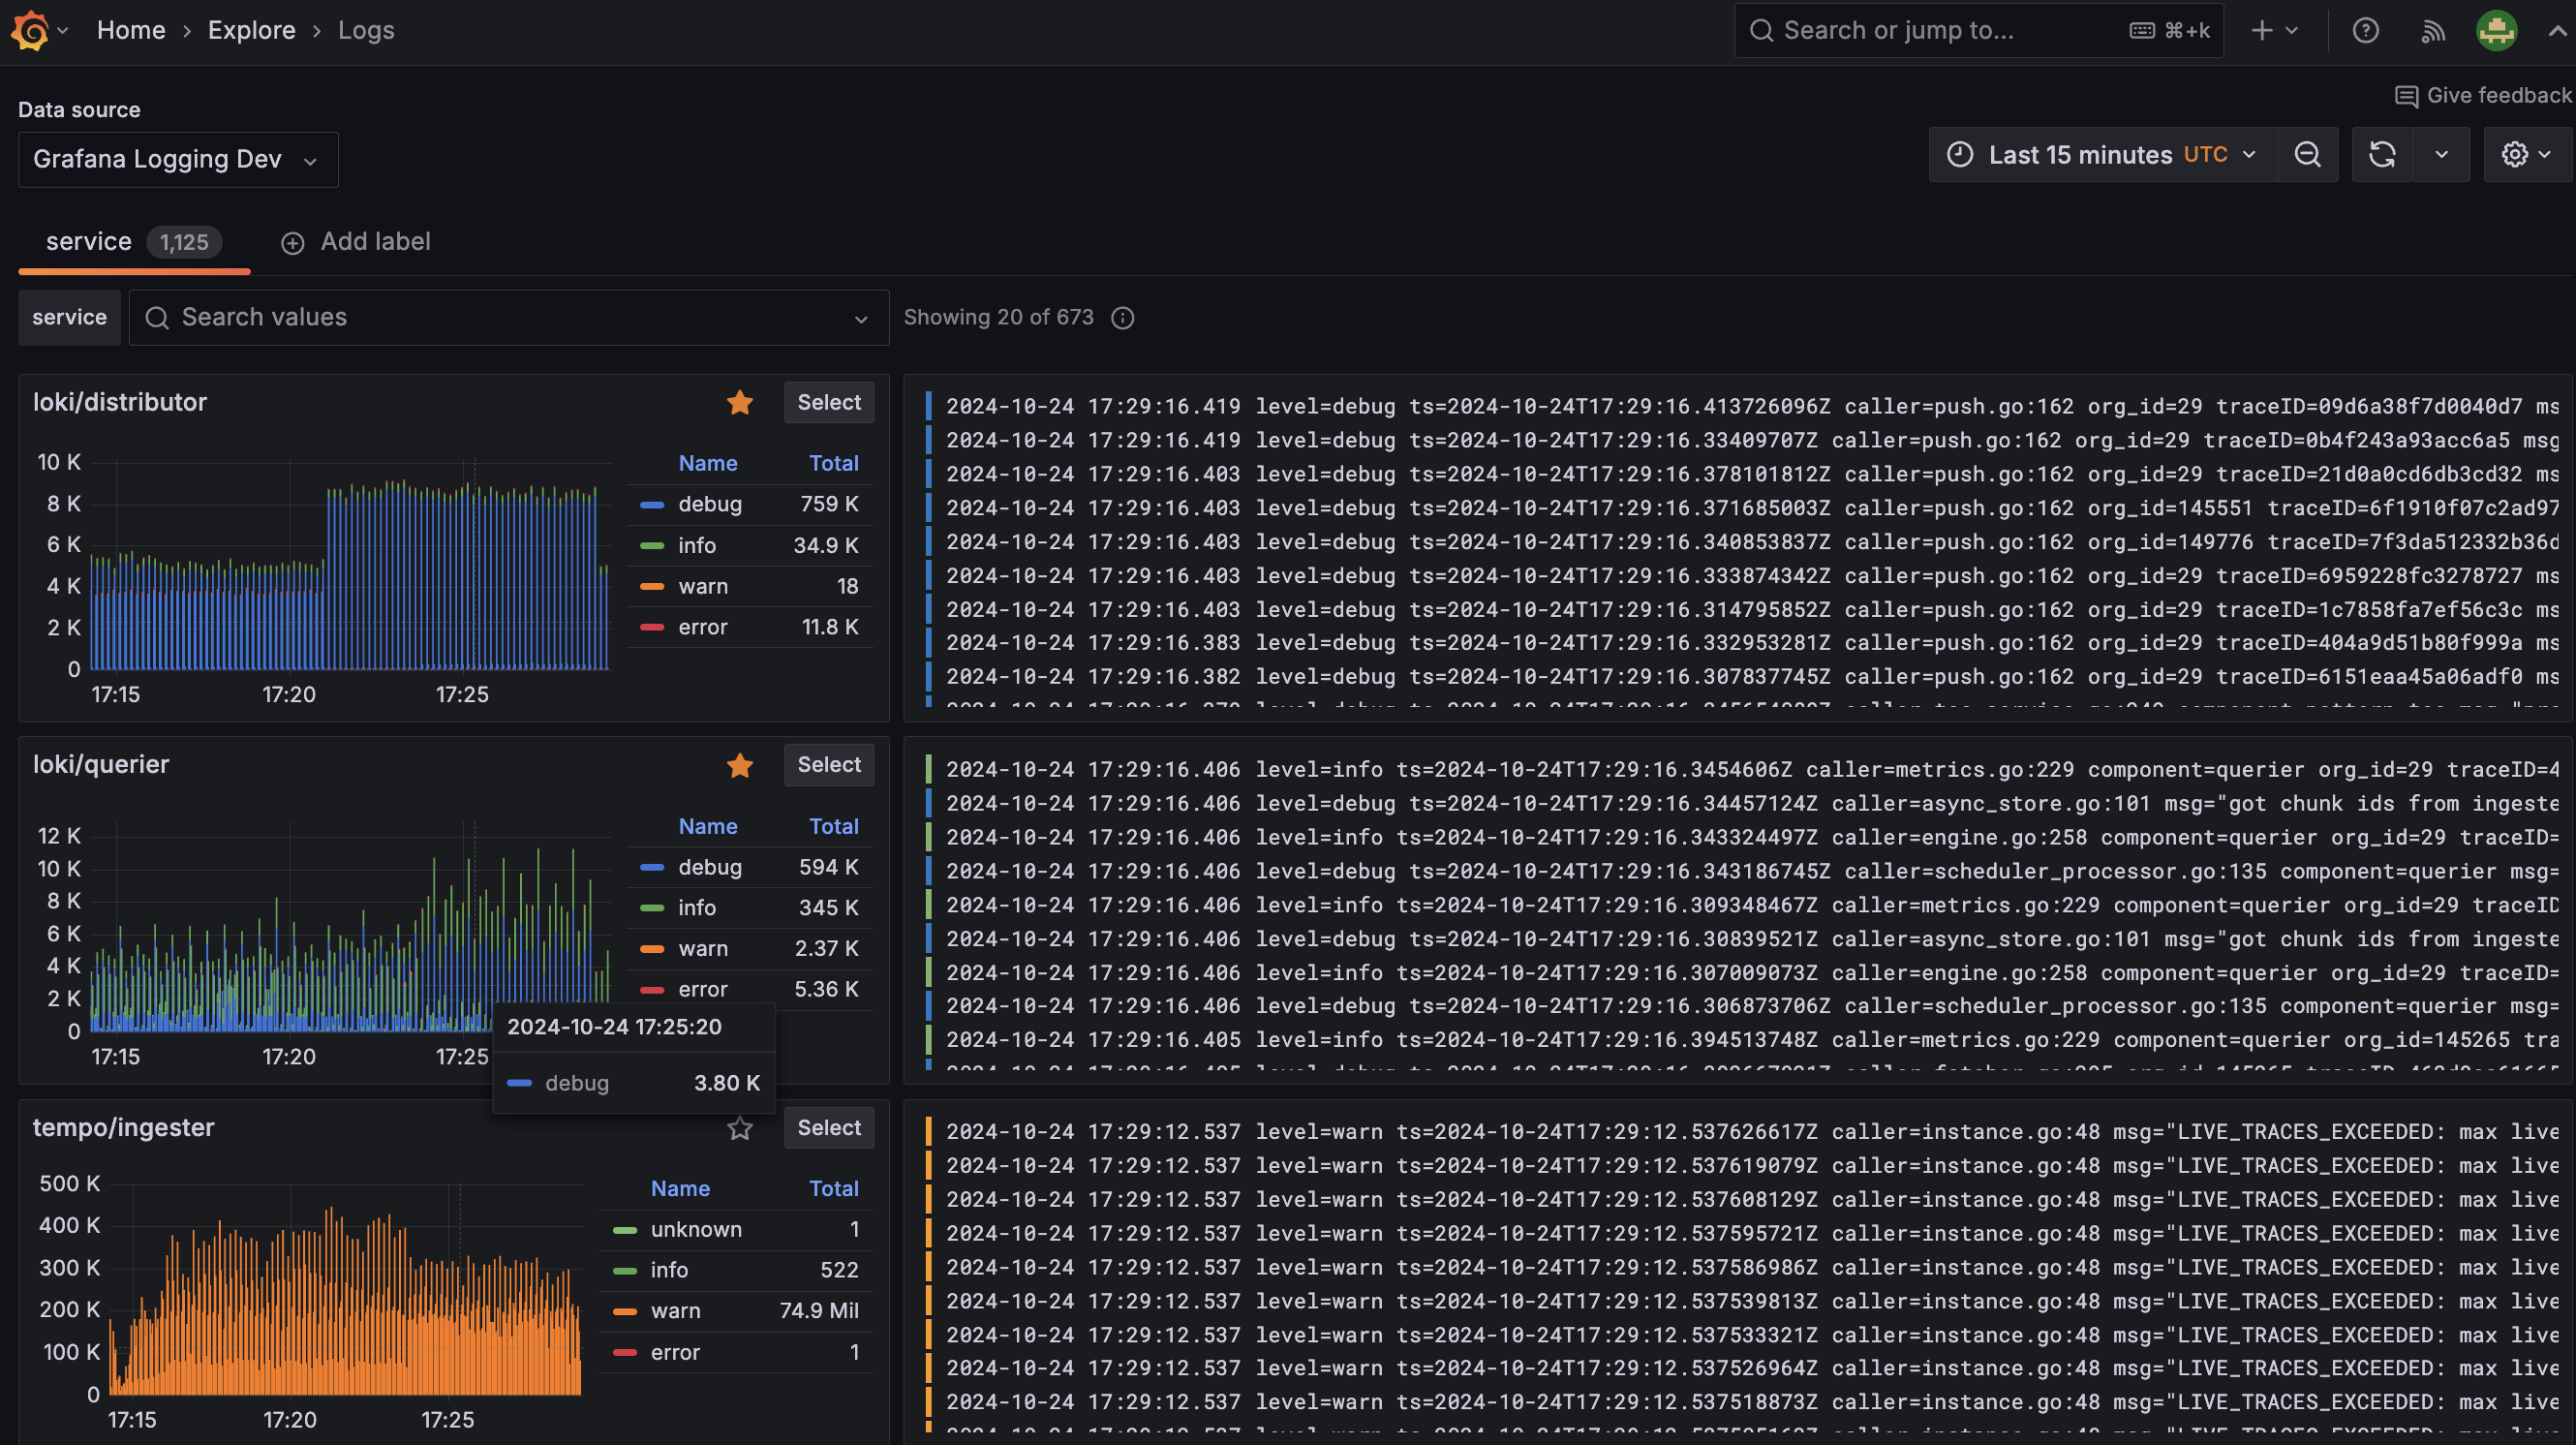
After all done and agents restarted you can navigate to Explore page in Grafana, select Tempo as datasource and get recent Datadog traces.
Conclusions
- Kudos to Grafana and Datadog – Their collaboration on the
otelcol.receiver.datadogmakes transitioning between monitoring platforms smoother than ever, reducing friction for hybrid observability. - Hybrid Monitoring is the New Normal – Applications no longer rely on a single monitoring provider throughout their lifespan. As infrastructure evolves, businesses will inevitably switch or integrate multiple observability tools.
- Stay Agile with Open Standards – Using OpenTelemetry ensures flexibility, allowing teams to adapt their monitoring stack without vendor lock-in, keeping observability seamless across hybrid and multi-cloud environments.
By embracing open standards, organizations can future-proof their monitoring strategies while ensuring complete visibility across their hybrid infrastructure. 🚀