Kubernetes operator provide easy and simple way to extend Kubernetes cluster with additional functionality.
For example you might find that you need custom operator in areas like:
- Managing stateful applications: take any Database, Message Queue or Cache as example, it needs full lifecycle of operations to be good for production. For a long time running databases in Kubernetes was an anti-pattern, but with operators things started to changed.
- Automating Application Lifecycle Management: the complexity of making new application can be overwhelmed for your development teams, so why not to introduce something more simple with just few core fields which are shared between all applications.
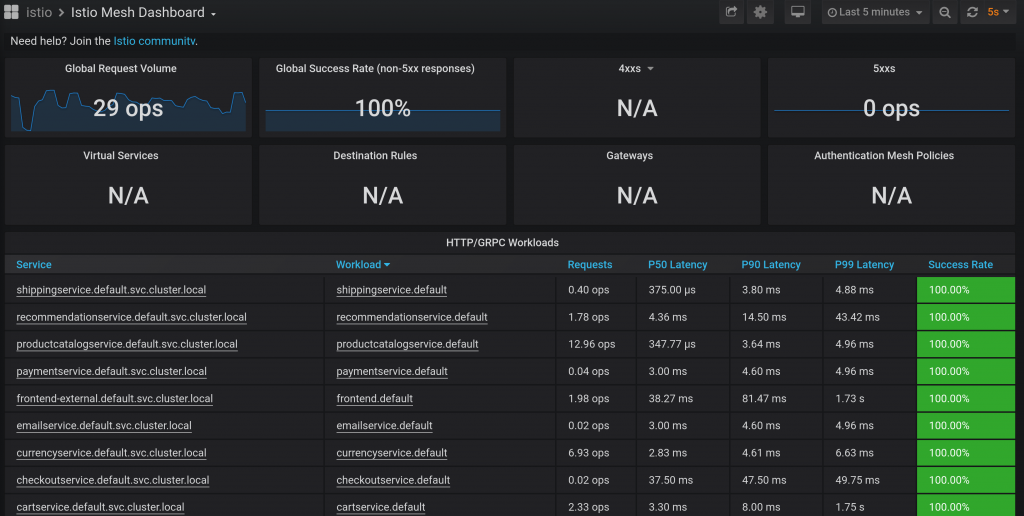
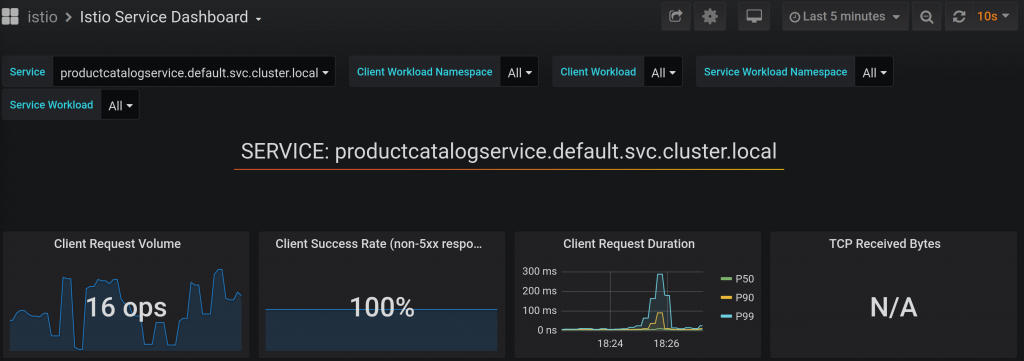
- Enhancing Observability: operators like Prometheus operator or Alermanager hides complexity of managing these tools and provide simple interface to get started quick.
- Automated Backup, Restore, and Disaster Recovery: For stateful applications, operators can automate the process of taking regular backups, storing them securely, and orchestrating the restoration process in case of data loss or system failure.
- CI/CD and GitOps Automation: operators play crucial role in GitOps workflow. Tools like the Pulumi Kubernetes Operator enable managing infrastructure alongside Kubernetes workloads.
- Networking and Security Management: Operators for service meshes like Istio or Linkerd simplify their installation, configuration, and upgrades across the cluster.
- Building Platform-as-a-Service (PaaS)-like Capabilities: By abstracting away underlying Kubernetes resources, operators can provide a simplified, application-centric interface for developers, similar to what a PaaS offers.
Writing your own operator
If you think to get started to write your own operator it’s good to know what any operator consist of:
API Design
Custom Resource Definition (CRD) Design. The CRD is the API your users (and other tools) will interact with. A well-designed CRD is intuitive, clear, and extensible. A poorly designed one can be confusing and hard to evolve.
// AppoperatorSpec defines the desired state of Appoperator.
type AppoperatorSpec struct {
	// Image specify the container image for the deployment
	Image string `json:"image,omitempty"`

	// Replicas specify the container replica count for the deployment
	Replicas *int32 `json:"replicas,omitempty"`
}

// AppoperatorStatus defines the observed state of Appoperator.
type AppoperatorStatus struct {
	// Conditions represent the latest available observations of the Appoperator's state.
	Conditions []metav1.Condition `json:"conditions,omitempty"`
}
- Keep the
spec(desired state) as simple as possible for the user, abstracting away unnecessary complexity. - Implement robust OpenAPI v3 schema validation in your CRD to catch errors early and guide users.
- Design a comprehensive
statussubresource to provide clear feedback to users about the state of the managed resources and any errors.
Reconciliation Loop Logic
This is the heart of your operator. It’s the code that observes the current state of the system and the desired state (from the CR) and takes action to make them match.
log := logf.FromContext(ctx)

// Fetch the Appoperator instance
var appoperator toolsv1beta1.Appoperator
if err := r.Get(ctx, req.NamespacedName, &appoperator); err != nil {
    if apierrors.IsNotFound(err) {
	// The resource was deleted, nothing to do
	return ctrl.Result{}, nil
    }
    log.Error(err, "Failed to fetch Appoperator")
    return ctrl.Result{}, err
}
// Logic to create deployment
// Logic to compare current deployment with spec
- The reconcile function must be idempotent. This means running it multiple times with the same inputs should produce the same outcome without unintended side effects.
- Properly handle errors from API calls or other operations. Decide whether an error is terminal or if the reconciliation should be retried.
- Ensure you correctly create, update, and delete managed resources (Deployments, Services, etc.). Avoid leaking resources.
State Management
Operators often manage stateful applications or complex workflows. Ensuring the operator correctly understands and transitions between states is vital.
deployment := &appsv1.Deployment{
	ObjectMeta: metav1.ObjectMeta{
		Name:      appoperator.Name,
		Namespace: appoperator.Namespace,
	},
	Spec: appsv1.DeploymentSpec{
		Replicas: appoperator.Spec.Replicas,
		Selector: &metav1.LabelSelector{
			MatchLabels: map[string]string{"app": appoperator.Name},
		},
		Template: corev1.PodTemplateSpec{
			ObjectMeta: metav1.ObjectMeta{
				Labels: map[string]string{"app": appoperator.Name},
			},
			Spec: corev1.PodSpec{
				Containers: []corev1.Container{
					{
						Name:  "app-container",
						Image: appoperator.Spec.Image,
					},
				},
			},
		},
	},
}
// Get existing deployment
// Compare with CR state and update if necessary
- Accurately read the current state of all managed resources from the Kubernetes API server before making decisions.
- Implement logic to detect differences between the CR
specand the actual state of the cluster. - Be mindful of potential race conditions
Owner References and Garbage Collection
Proper use of owner references is essential for ensuring that Kubernetes automatically cleans up resources created by your operator when the parent Custom Resource is deleted.
- Ensure that all resources created and managed by the operator have an
ownerReferencepointing back to the instance of your Custom Resource that “owns” them. - If your operator needs to perform actions before its Custom Resource can be deleted (e.g., de-provisioning an external resource, taking a final backup), use finalizers. This prevents the CR from being deleted until the operator removes the finalizer.
Status Reporting
Users rely on the status of your Custom Resource to understand what the operator is doing and whether their application is healthy.
- Use standard Kubernetes
Conditions(e.g.,Type: Ready,Status: True/False/Unknown) to provide a standardized way of reporting status. - Include informative messages and reasons in your status conditions.
- Reflect the
metadata.generationof the CR that was processed in thestatus.observedGeneration. This helps users and other tools understand if the status reflects the latest changes to thespec.
Versioning
Versioning is a critical aspect of developing and maintaining Kubernetes operators, as it impacts how users interact with your custom APIs and how your operator software evolves. It breaks down into two main areas: CRD (API) Versioning and Operator Software Versioning
A single CRD can define multiple API versions in its spec.versions list. In Kubernetes, all versions must be safely round-tripable through each other. This means that if we convert from version 1 to version 2, and then back to version 1, we must not lose information.
Operator software versioning refers to how you version the operator’s code and container image. Users need to know which version of the operator software supports which features and CRD versions.
Effective versioning requires a disciplined approach. For CRDs, follow Kubernetes API conventions, plan for conversions, and clearly communicate stability and deprecation. For operator software, use semantic versioning, clearly map operator versions to the CRD versions they support, and have a robust upgrade strategy, potentially leveraging tools like OLM. Both aspects are crucial for the long-term health and usability of your operator.
Create with Kubebuilder
Kubebuilder isn’t just providing boilerplate code and some level of automation, but it also a great learning resource to get start with operators. It covers:
- The structure of Kubernetes APIs and Resources
- API versioning semantics
- Self-healing
- Garbage Collection and Finalizers
- Declarative vs Imperative APIs
- Level-Based vs Edge-Base APIs
- Resources vs Subresources
- and more.
Generating manifests, running test, deployment and installation and other useful command available to make things easier from the start.
Summary
Kubernetes operators provide a powerful way to extend cluster functionality, primarily by automating the complex lifecycle management of applications (especially stateful ones like databases), enhancing observability, and enabling PaaS-like capabilities.
Developing a robust operator requires careful attention to its API (CRD) design, implementing idempotent reconciliation logic for state management, ensuring proper resource cleanup via owner references, clear status reporting, and disciplined versioning for both the CRD and the operator software.