Distributed applications and microservices required high level of observability. In this article we will integrate a Flask micro framework with Jaeger tracing tool. All code will be deployed to Kubernetes minikube cluster.
Flask
Let’s build a simple task manager service using Flask framework.
Code
tasks.py
from flask import Flask, jsonify
app = Flask(__name__)

@app.route('/')

tasks = {"tasks":[
        {"name":"task 1", "uri":"/task1"},
        {"name":"task 2", "uri":"/task2"}
    ]}

def  root():
	"Service root"
	return  jsonify({"url":"/tasks")

@app.route('/tasks')
def  tasks():
	"Tasks list"
	return  jsonify(tasks)

if __name__ == '__main__':
  "Start up"
  app.run(debug=True, host='0.0.0.0',port=5000)
I have skipped other CRUD operations for simplicity.
Lets check the service is working(don’t forget pip install flask):
python tasks.py
* Serving Flask app "tasks" (lazy loading)
* Environment: production
WARNING: This is a development server. Do not use it in a production deployment.
Use a production WSGI server instead.
* Debug mode: on
* Running on http://0.0.0.0:5000/ (Press CTRL+C to quit)
* Restarting with stat
* Debugger is active!
* Debugger PIN: 423-713-676
Check tasks list curl localhost:5000/tasks
{
  "tasks": [
    {

      "name": "task 1",
      "uri": "/task1"
    },
    {
      "name": "task 2",
      "uri": "/task2"
    }
  ]
}
All good, time to add tracing.
Jaeger client
Now it’s time to teach our application how to talk Jaeger language.
When we instrument the code with Jaeger client, the client will start collect tracing metrics for the Flask routes.
Collected metrics will be sent to Jaeger agent. Default hostname of Jaeger agent is localhost, so we would need to make sure Jaeger agent available at localhost or change the hostname value.
To add Jaeger client is to create initialization function and instantiate tracing object.
tasks.py
from flask import Flask, jsonify
from jaeger_client import Config
from flask_opentracing import FlaskTracer

app = Flask(__name__)

def  initialize_tracer():
  "Tracing setup method"
  config = Config(
			    config={
      'sampler': {'type': 'const', 'param': 1},
    },
    service_name='tasks-service')
  return config.initialize_tracer()

flaskTracer = FlaskTracer(lambda: initialize_tracer(), True, app)
Where:
service_name='tasks-service'– is the application level label for all tracing samples. You will use it to filter metrics in Jaeger UI.FlaskTracer(lambda: initialize_tracer(), True, app)do following:lambda: initialize_tracer()– lambda is used to postpone tracing initialization call which is conflicting with Flask threads. See Jaeger client issue 60True– tell Jaeger to track all Flask routesapp– is a Flask app instance
Update requirements.txt file with tracing modules:
flask
jaeger_client
flask_opentracing
Packaging and publishing using Docker
Docker is a great tool to package and distribute application across platforms.
On this step we will create a Dockerfile to build tasks-service image and publish it on a registry.
You would need a Docker registry account which you can register for free at Docker hub.
After you created new account you need to dodocker loginto authorize in terminal
Dockerfile is based on python 3.8 and alpine linux. So, the end image will be quite small:
FROM  python:3.8-alpine
COPY  requirements.txt  requirements.txt
RUN  pip  install  -r  requirements.txt
COPY  tasks.py tasks.py
EXPOSE  5000
ENTRYPOINT  ["python"]

CMD  ["tasks.py"]
Build the Dockerfile
To publish docker image you need to tag it with valid docker registry name. Your would need to change ‘vorozhko’ to your docker registry name.
docker build -t vorozhko/tasks-service:0.0.1 .Now it’s time to publish tasks-service image on Docker hub
docker push vorozhko/tasks-service:0.0.1Now when we have a Docker container it’s time to test our application and Jaeger tracing tool. One way to do it is to use Kubernetes minikube cluster which is perfect for local development.
Install tasks-service in Kubernetes
Make sure your kubectl is properly configured to talk to Kubernetes cluster or you can use minikube to setup one
Create a Kubernetes deployment for tasks-service:
kubectl create deployment tasks-service --image=vorozhko/tasks-service:0.0.1Expose tasks-service to access the service:
kubectl expose deployment tasks-service --port=5000 --target-port=5000 --type=NodePortNow determine minikube ip and port number:
export MINIKUBEIP=$(minikube ip)
export SERVICEPORT=$(kubectl get svc tasks-service -o jsonpath='{.spec.ports[0].nodePort}')
Test the service:
curl http://$MINIKUBEIP:$SERVICEPORT
{
  "tasks": [
    {
      "name": "task 1",
      "uri": "/task1"
    },
    {
      "name": "task 2",
      "uri": "/task2"
    }
  ]
}
All right, so our tasks-service is running and working correctly. Now we need Jaeger infrastructure to be in place. We would also need to configure Jaeger agent to run as a sidecar for our application – this way it will be available on localhost.
Setup Kubernetes Jaeger Operator
Kubernetes Jaeger operator simplify managing Jaeger service instances.
In this setup Kubernetes Jaeger operator will watch all namespaces for Jaeger CRs(Custom Resources).
The following instructions will create observability namespace and install Jaeger operator there:
kubectl create namespace observability
kubectl create -f https://raw.githubusercontent.com/jaegertracing/jaeger-operator/master/deploy/crds/jaegertracing.io_jaegers_crd.yaml
kubectl create -n observability -f https://raw.githubusercontent.com/jaegertracing/jaeger-operator/master/deploy/service_account.yaml
kubectl create -n observability -f https://raw.githubusercontent.com/jaegertracing/jaeger-operator/master/deploy/role.yaml
kubectl create -n observability -f https://raw.githubusercontent.com/jaegertracing/jaeger-operator/master/deploy/role_binding.yaml
kubectl create -n observability -f https://raw.githubusercontent.com/jaegertracing/jaeger-operator/master/deploy/operator.yaml
kubectl create -f https://raw.githubusercontent.com/jaegertracing/jaeger-operator/master/deploy/cluster_role.yaml
kubectl create -f https://raw.githubusercontent.com/jaegertracing/jaeger-operator/master/deploy/cluster_role_binding.yaml
At this point there are should be Jaeger operator available:
kubectl get deployment jaeger-operator -n observability

NAME              DESIRED   CURRENT   UP-TO-DATE   AVAILABLE   AGE
jaeger-operator   1         1         1            1           25s
Initiate Jaeger instance
We will create Jaeger instance using Jaeger operator custom resource:
echo "
apiVersion: jaegertracing.io/v1
kind: Jaeger
metadata:
  name: jaeger-service" | kubectl create -f -
In few moments you should see:
kubectl get jaegers.jaegertracing.io
NAME             STATUS    VERSION   STRATEGY   STORAGE   AGE
jaeger-service   Running   1.18.0    allinone   memory    15s

kubectl get pods -lapp=jaeger
NAME                              READY   STATUS    RESTARTS   AGE
jaeger-service-7f4ddf6668-s4x55   1/1     Running   0          90s
To access Jaeger UI from host machine expose Jaeger UI service:
kubectl patch svc jaeger-service-query -p '{"spec":{"type":"NodePort"}}'
export JAEGERPORT=$(kubectl get svc jaeger-service-query -o jsonpath='{.spec.ports[0].nodePort}')
echo http://$MINIKUBEIP:$JAEGERPORT
At this point we instrumented the app with Jaeger code and deployed it to Kubernetes cluster. But, Jaeger client need to communicate with Jaeger agent and by default it is looking for it at localhost. So, lets make Jaeger agent available at localhost using Kubernetes deployment pattern sidecar container.
Setup Jaeger agent
Thankfully to Jaeger Kubernetes operator it is quite easy to add Jaeger agent sidecar container.
kubectl annotate deployments.apps tasks-service sidecar.jaegertracing.io/inject=true
deployment.apps/configs-api annotated

kubectl get pods -lapp=tasks-service
NAME                             READY   STATUS    RESTARTS   AGE
tasks-service-79d9977fdc-szxps   2/2     Running   0          103s
Notice 2/2 Ready which means tasks-service Pod now contains two containers: tasks-service and jaeger-agent and they are ready to serve traffic.
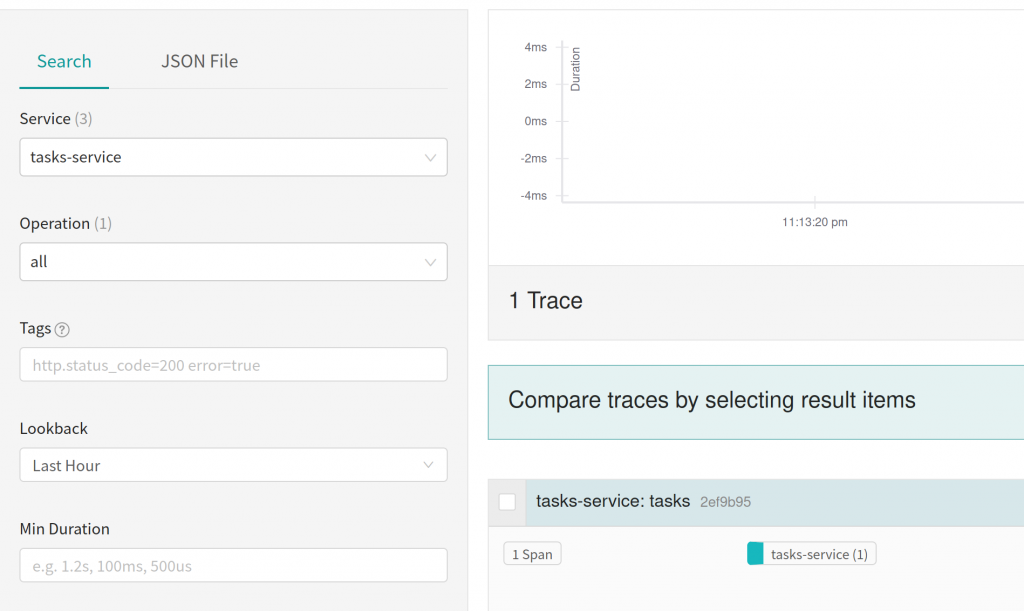
Let’s make few request to tasks-service and check for new tracers in Jaeger UI.
watch curl http://$MINIKUBEIP:$SERVICEPORT/tasksOpen Jaeger UI at http://$MINIKUBEIP:$JAEGERPORT
On the search page you should see a number of tracing spans
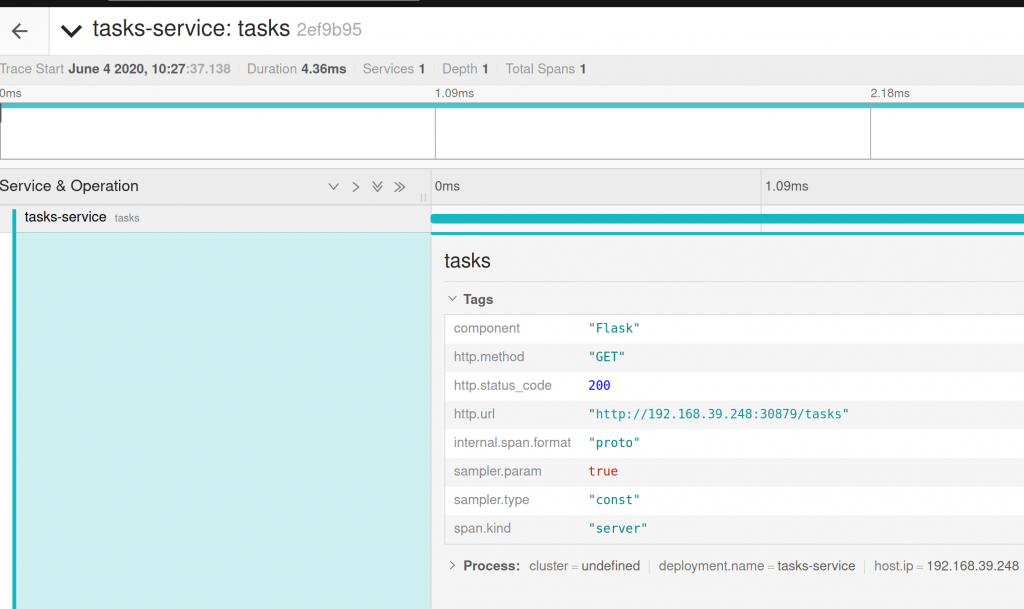
and clicking on one of the span will open details page
Conclusions
Jaeger tracing tools is must have feature for microservices, distributed application and event based applications. It brings you one step closer to the internals of application behavior and help a lot in incident management and debugging process.
Kubernetes Jaeger operator make a great deal of simplifying Jaeger deployment. I really enjoyed how easy it was to setup.