Collecting Datadog APM traces using Grafana Alloy and Tempo

The Problem

Hybrid cloud is the future, but monitoring remains stuck in the past. Many organizations embrace hybrid infrastructure, yet struggle with fragmented observability tools. Why? Because monitoring providers still operate in silos.

One of the primary reasons hybrid monitoring isn’t as prevalent is the challenge of instrumentation. Many cloud providers offer their own monitoring solutions. Instrumentation libraries are often incompatible with one another, making cross-platform integration difficult.

The good news? With OpenTelemetry, Grafana, and Datadog, hybrid monitoring is becoming easier and more flexible. 🚀

The Solution

One promising development is the rise of open-source, vendor-neutral instrumentation frameworks like OpenTelemetry.

In essence, open standards are reducing incompatibility issues and allowing “a vendor-agnostic approach to get data from the sources you need to the observability service of your choice.”

A step toward solving the hybrid cloud monitoring challenge came when Grafana introduced the otelcol.receiver.datadog component.

Now, with otelcol.receiver.datadog, Grafana users can ingest and process Datadog telemetry directly within OpenTelemetry pipelines, unlocking several advantages:

  1. Expanding Grafana’s Reach to Datadog Customers
  2. Seamless Integration with OpenTelemetry Pipelines
  3. Avoiding Vendor Lock-in While Retaining Datadog’s Strengths
  4. Cost Optimization by Centralizing Hybrid Monitoring

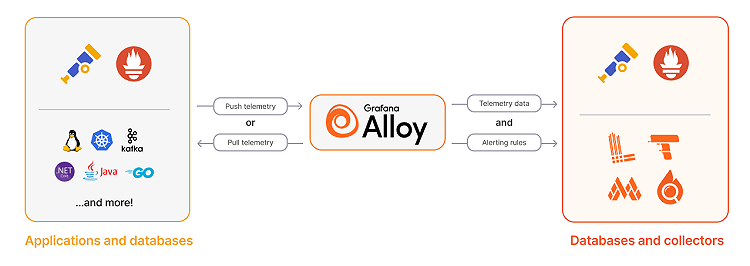
How it works together?

Requirements

  1. Grafana – for web UI
  2. Grafana Alloy – to receive, process and export telemetry data
  3. Grafana Tempo – to collect and visualize traces from Datadog instrumented apps
  4. Datadog agent – with enabled APM feature
  5. Instrumented application with Datadog trace library

Quick check list:

  1. you have running: Grafana, Alloy and Tempo services
  2. You have running Datadog agents
  3. You have instrumented applications with Datadog trace library
  4. You add Tempo as Datasource in Grafana

Grafana Alloy configuration

The core of the solution is to set up Datadog receiver in Alloy config:

receivers:
datadog:
endpoint: "0.0.0.0:9126"
output:
traces: [otelcol.exporter.otlp.tempo.input]

# I am skipping extra steps which you might want to use to pre-proces data

otelcol:
exporter:
otlp:
tempo:
client:
endpoint: "https://tempo-distributor.example.com:443"
tls:
insecure: false
insecure_skip_verify: true

To avoid ports conflict with Datadog agent we choose 9126 as a port for Alloy Datadog receiver.

Running Alloy as Daemonset with hostNetwork access allow agent to be present on each Node.

alloy:
extraPorts:
- name: "datadog"
port: 9126
targetPort: 9126
protocol: "TCP"

controller:
hostNetwork: true
hostPID: true

service:
internalTrafficPolicy: "Local"

Application set up

Application has to be configured to send APM traces to Node IP:1926.

The Node IP can be extracted form Kubernetes meta information and passed as environment variable:

env:
- name: NODE_IP
valueFrom:
fieldRef:
fieldPath: status.hostIP

Datadog Agent configuration

With Datadog Agent we have two options:

  1. Send traces to Alloy Datadog receiver as addition to Datadog host
  2. Send traces only to Alloy Datadog receiver

With option 1 we assume you are using both Datadog and Grafana solutions in hybrid mode. In that case Datadog agent has to have following configuration:

agents:
containers:
agent:
env:
- name: DD_ADDITIONAL_ENDPOINTS
value: '{"http://alloy-service:9126": ["datadog-receiver"]}'
- name: DD_APM_ADDITIONAL_ENDPOINTS
value: '{"http://alloy-service:9126": ["datadog-receiver"]}'
traceAgent:
enabled: true
env:
- name: DD_ADDITIONAL_ENDPOINTS
value: '{"http://alloy-service:9126": ["datadog-receiver"]}'
- name: DD_APM_ADDITIONAL_ENDPOINTS
value: '{"http://alloy-service:9126": ["datadog-receiver"]}'

For option 2 where traces must go only to Alloy Datadog receiver following configuration might work:

datadog:
apm:
socketEnabled: true # Use the Unix Domain Socket (default). Can be true even if port is enabled.
portEnabled: true # Enable TCP port 8126 for traces.
useLocalService: false

env:
- name: DD_APM_DD_URL
value: "http://alloy-service:9126" # URL for OTel collector’s Datadog trace receiver
- name: DD_APM_NON_LOCAL_TRAFFIC
value: "true"

After all done and agents restarted you can navigate to Explore page in Grafana, select Tempo as datasource and get recent Datadog traces.

Conclusions

  1. Kudos to Grafana and Datadog – Their collaboration on the otelcol.receiver.datadog makes transitioning between monitoring platforms smoother than ever, reducing friction for hybrid observability.
  2. Hybrid Monitoring is the New Normal – Applications no longer rely on a single monitoring provider throughout their lifespan. As infrastructure evolves, businesses will inevitably switch or integrate multiple observability tools.
  3. Stay Agile with Open Standards – Using OpenTelemetry ensures flexibility, allowing teams to adapt their monitoring stack without vendor lock-in, keeping observability seamless across hybrid and multi-cloud environments.

By embracing open standards, organizations can future-proof their monitoring strategies while ensuring complete visibility across their hybrid infrastructure. 🚀

Cost saving strategy for Kubernetes platform

Working on cost saving strategy involves looking at the problem from very different dimensions.
Overall Kubernetes costs can be split on compute costs, networking costs, storage costs, licensing cost and SaaS costs.
In this part I will cover: Right-size infrastructure & use autoscaling

Right-size infrastructure & use autoscaling

Kubernetes Nodes autoscaler

In a cloud environment Kubernetes Nodes autoscaler plays important role in delivering just enough resources for your cluster. In a nutshell:

  • it adds new nodes according to demand – up scale
  • it consolidates under utilized nodes – down scale

It directly depends on Pod resource requests. Choosing the right requests is the key component for cost-effective strategy.
For self hosted solutions you might want to look into project like Karpenter.
Alternative scaling strategy is to add or remove nodes by schedule for a specific time plan. Using that approach you can simple specify the time of the day when you need to upscale and the time when you downscale.

Continue reading Cost saving strategy for Kubernetes platform

Grafana a new look

As much as l like managed monitoring solutions it’s hard not to be excited about setting up your own platform based on Prometheus Grafana stack and save some bucks for the company.

After 5 years of using proprietary solutions I am again on the way to get into Grafana world.

Here I want to wrap up what I learnt so far about Grafana.

Big ecosystem of tools

The biggest change for me is ecosystem of projects which supports almost all imaginable monitoring needs.

  • For Logs: Loki and Promtail
  • For Traces: Tempo
  • For Profiling: Peryscope
  • For open telemetry collecting: Alloy
  • For eBPF: Beyla
  • For Synthetics: Prometheus BlackBox and K6 API
  • and many more

Automated Deployment process

A lot was done in the deployment process where using Helm charts you can get it up and running in a minutes.

All that comes with scalability and high availability in mind.

Though you would need to connect and customize each component, it’s still can be just a Helm configuration change.

Huge ecosystem of Components to simplify instrumentation

It’s clear your code has to be instrumented to be observable. Grafana and their Open Source community developed a number of tools to make it easy and simple:

  1. Compatible receivers for big providers like Datadog
  2. New discovery methods like eBPF
  3. No code way of instrumentation like sidecar container

And a lot more see the Alloy components section to get started.

New fresh UI

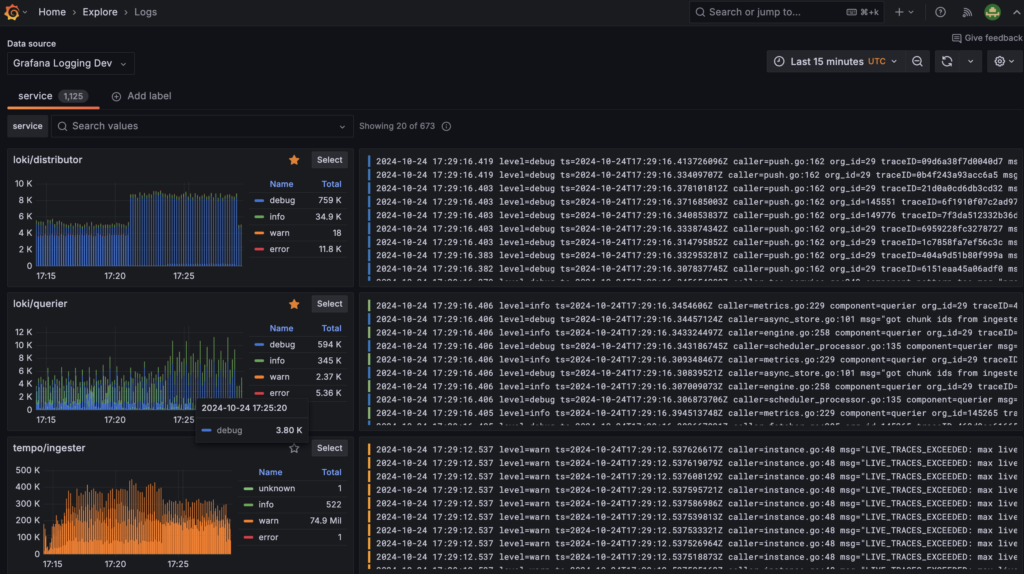
Grafana Logs and Metrics get new look.

You can see multiple logs and metrics on the same page.

Summary

It’s cool, it’s fresh and it’s a lot of fun to use!

Can ArgoCD replace Helm managers?

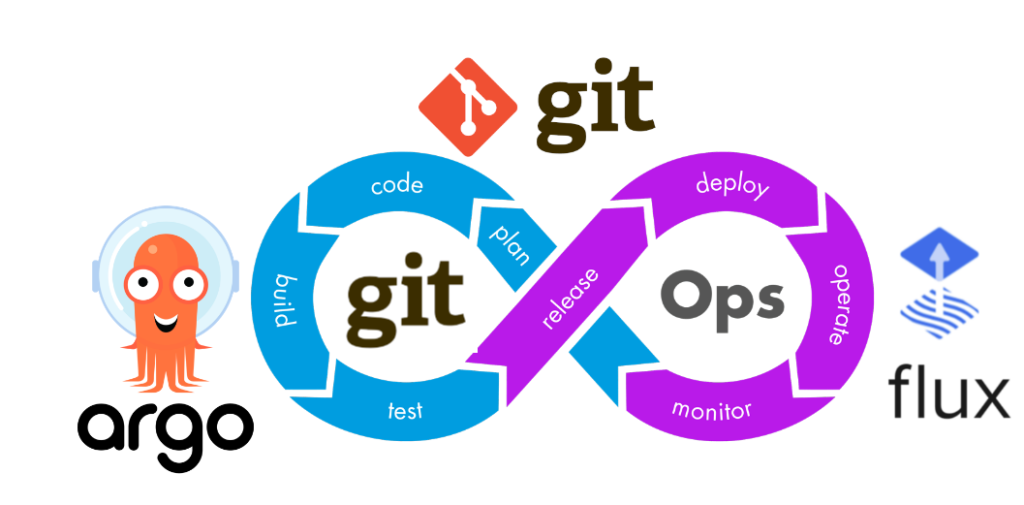
Argocd gitops flux
Argocd gitops flux cycle

ArgoCD is a tool which provides GitOps way of deployment. It supports various format of applications including Helm charts.

Helm is one of the most popular packaging format for Kubernetes applications. It give a rise to various tools to manage helm chart like helmfiles, helmify and others.

Why ArgoCD is replacing Helm managers?

For a long time Helm managers help to deploy Helm charts via different deploy strategies. It serves well, but the big disadvantage was a code drift which accumulate over time.

To avoid code drift one solution was to schedule a period job which will apply latest changes to Helm charts. Sometimes it works, but most often if one of the charts get install issue all other charts stop being updated as well.
So, it wasn’t ideal way to handle it.

In that situation ArgoCD comes to a rescue. ArgoCD allow to control the update of each chart as a dedicated process where issue in one chart will not block updates on other charts. Helm charts in ArgoCD is a first class citizen and support most of it features.

How it looks like in ArgoCD?

To try it out lets start with a simple Application which will install Prometheus helm chart with a custom configuration.

Prometheus helm chart can be found at https://prometheus-community.github.io/helm-charts

Custom configuration will be stored in our internal project https://git.example.com/org/value-files.git

Thanks to multi source support in Application we can use official chart and custom configuration together like in the following example:

apiVersion: argoproj.io/v1alpha1
kind: Application
spec:
  sources:
  - repoURL: 'https://prometheus-community.github.io/helm-charts'
    chart: prometheus
    targetRevision: 15.7.1
    helm:
      valueFiles:
      - $values/charts/prometheus/values.yaml
  - repoURL: 'https://git.example.com/org/value-files.git'
    targetRevision: dev
    ref: values

Where `$values is a reference to root folder of values-files repository. That values file override default prometheus settings, so we can configure it for our needs.

What’s next?

There are several distinct feature which Helm managers support, so your next step is to check if ArgoCD cover all your needs.

One of the notable feature is secrets support. Many managers support SOPS format of secrets where ArgoCD don’t give you any solution, so it’s up to you how to manage secrets.

Other important feature is order of execution which can be important part of your Helm manager setup. ArgoCD don’t have built-in replacement, so you have to rely on Helm format to support dependencies. One way is to build umbrella charts for the complex applications.

Most important change is the GitOps style of deployment. ArgoCD doesn’t run CI/CD pipeline, so you don’t have a feature like helm diff to preview changes before applying. It will apply them as soon as they become available in the linked git repository.

Conclusions

  1. ArgoCD can replace Helm managers, but it strongly depend on your project needs.
  2. ArgoCD introduce new challenges like secrets managers and order of execution.
  3. It introduce GitOps deployment style and replace usual CI/CD pipeline, so new “quality gates” needs to be build to be ready for production environment.

Implementing RED method with Istio

In this article I describe how to quickly get started with SLO and SLI practice using Istio. if you are new SLO and SLI read a Brief Summary of SRE best practices.

RED or Rate Errors Duration

The RED method is an easy to understand monitoring methodology. For every service, monitor:

Rate – how many operations per second is placed on a service
Errors – what percentage of the traffic return in error state
Duration – the time it take to serve a request or process a job

Rate, Errors, Duration are a good Service Level Indicators to start, because undesirable change in any of it directly impact your users.
Examples of Service Level Objectives for RED indicators:

  • Number of Requests are above 1000 operations per minute or Number of Requests don’t drop more than on 10% for 10 minutes period
  • Errors rate are below 0.5%
  • Request Latency for 99% of operations are less than 100ms

For a microservices platform, RED is a perfect metrics to start with. But how to collect and visualize them for a big number of services?

Enter Istio.

Deploying Kubernetes, Istio and demo Apps

Tools for a demo

  • minikube – local Kubernetes cluster to test our setup (optional if you have a demo cluster)
  • skaffold – an application for building and deploying demo microservices
  • istioctl – istio command line tool
  • Online Boutique – a cloud-native microservices demo application

Kubernetes and Istio

For our demo we would need following cluster specs with default Istio setup.

minikube start --cpus=4 --memory 4096 --disk-size 32g
curl -L https://istio.io/downloadIstio | sh -
cd istio-1.6.4
bin/istioctl install --set profile=demo
kubectl label namespace default istio-injection=enabled

Demo applications

For test applications I am using Online Boutique which is cloud native microservices demo from Google Cloud Platform team.

git clone https://github.com/GoogleCloudPlatform/microservices-demo.git
cd microservices-demo
skaffold run # this will build and deploy applications. take about 20 minutes

Verify that applications are installed:

kubectl get pods
NAME                                     READY   STATUS    RESTARTS   AGE
adservice-85cb97f6c8-fkbf2               2/2     Running   0          96s
cartservice-6f955b89f4-tb6vg             2/2     Running   2          96s
checkoutservice-5856dcfdd5-s7phn         2/2     Running   0          96s
currencyservice-9c888cdbc-4lxhs          2/2     Running   0          96s
emailservice-6bb8bbc6f7-m5ldg            2/2     Running   0          96s
frontend-68646cffc4-n4jqj                2/2     Running   0          96s
loadgenerator-5f86f94b89-xc7hf           2/2     Running   3          95s
paymentservice-56ddc9454b-lrpsm          2/2     Running   0          95s
productcatalogservice-5dd6f89b89-bmnr4   2/2     Running   0          95s
recommendationservice-868bc84d65-cgj2j   2/2     Running   0          95s
redis-cart-b55b4cf66-t29mk               2/2     Running   0          95s
shippingservice-cd4c57b99-r8bl7          2/2     Running   0          95s

Notice 2/2 Ready containers. One of the container is Istio sidecar proxy which will do all the job for collecting RED metrics.

RED metrics Visualization

Setup a proxy to Grafana dashboard

kubectl -n istio-system port-forward $(kubectl -n istio-system get pod -l app=grafana -o jsonpath='{.items[0].metadata.name}') 3000:3000 &

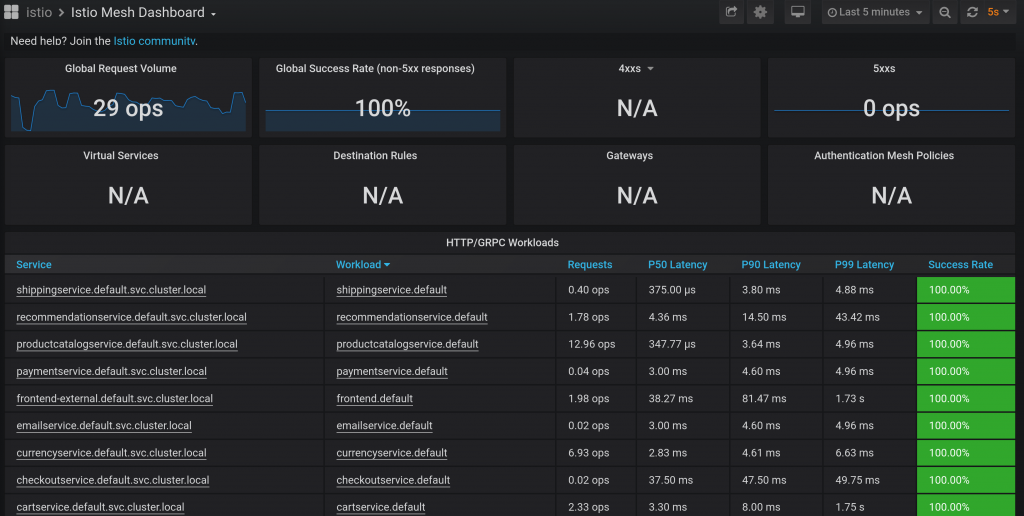
Open Grafana Istio Service Mesh dashboard for a global look at RED metrics

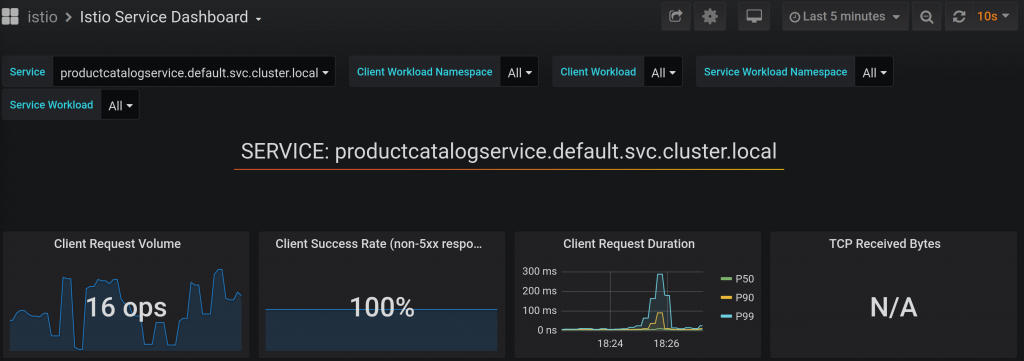
Detailed board for any service with RED metrics looks like:

Conclusions

Istio provide Rate, Errors and Duration metrics out of the box which is a big leap toward SLO and SLI practice for all services.

Incorporating Istio in your platform is a big toward observability, security and control of your service mesh.

Filebeats configuration for Kubernetes

filebeat.autodiscover:
  providers:
  - type: kubernetes
    node: ${NODE_NAME}
    hints.enabled: true
    hints.default_config:
      type: container
      paths:
        - /var/log/containers/*${data.kubernetes.container.id}.log

What’s so cool about above configuration

Filebeat Autodiscover

When you run applications on containers, they become moving targets to the monitoring system. Autodiscover allows you to track them and adapt settings as changes happen.

The Kubernetes autodiscover provider watches for Kubernetes nodes, pods, services to start, update, and stop.
As well it recognise a lot of additional labels and statuses related to Kubernetes objects.

Hints based autodiscover

Filebeat supports autodiscover based on hints from the provider. The hints system looks for hints in Kubernetes Pod annotations or Docker labels that have the prefix co.elastic.logs. As soon as the container starts, Filebeat will check if it contains any hints and launch the proper config for it. Hints tell Filebeat how to get logs for the given container.

Type Container

Use the container input to read containers log files.

This input searches for container logs under the given path, and parse them into common message lines, extracting timestamps too. Everything happens before line filtering, multiline, and JSON decoding, so this input can be used in combination with those settings.

Conclusions

Kubernetes logs autodiscovery and JSON decoding provide very good visibility into log stream. Labels and JSON log fields are properly named and parsed. Using ES and Kibana we can search through logs with easy queries and filter by fields.

References

Integrating Flask with Jaeger tracing on Kuberentes

Distributed applications and microservices required high level of observability. In this article we will integrate a Flask micro framework with Jaeger tracing tool. All code will be deployed to Kubernetes minikube cluster.

Flask

Let’s build a simple task manager service using Flask framework.

Code

tasks.py

from flask import Flask, jsonify
app = Flask(__name__)

@app.route('/')

tasks = {"tasks":[
        {"name":"task 1", "uri":"/task1"},
        {"name":"task 2", "uri":"/task2"}
    ]}

def  root():
	"Service root"
	return  jsonify({"url":"/tasks")
                     
@app.route('/tasks')
def  tasks():
	"Tasks list"
	return  jsonify(tasks)

if __name__ == '__main__':
  "Start up"
  app.run(debug=True, host='0.0.0.0',port=5000)
Continue reading Integrating Flask with Jaeger tracing on Kuberentes

Backup and restore of Etcd cluster

Kubernetes disaster recovery plan is usually consist of backing up etcd cluster and having infrastructure as a code to provision new set of servers in the cloud. Let’s see how to do first – backup etcd in two basic and easy ways.

Etcd backup

The only stateful component of Kubernetes cluster is etcd server. The etcd server is where Kuberenetes store all API objects and configuration.
Backing up this storage is sufficient for complete recovery of Kubernetes cluster state.

Backup with etcdctl

etcdctl is command line tool to manage etcd server and it’s date.
command to make a backup is:

Making a backup

ETCDCTL_API=3 etcdctl --endpoints $ENDPOINT snapshot save snapshot.db

command to restore snapshot is:

ETCDCTL_API=3 etcdctl snapshot restore snapshot.db

Note: For https endpoints you might need to specify paths to certificate keys in order to access etcd server api with etcdctl.

Store backup at remote storage

It’s important to backup data on remote storage like s3. It’s guarantee that a copy of etcd data will be available even if control plane volume is unaccessible or corrupted.

  • Make an s3 bucket.
  • Copy snapshot.db to s3 with new filename
  • Setup s3 object expiration to clean up old backup files
# new s3 bucket for etcd backups
aws s3 mb etcd-backup
# define a backup filename based on current date and time
filename=`date +%F-%H-%M`.db
aws s3 cp ./snapshot.db s3://etcd-backup/etcd-data/$filename
# set backup life cycle configuration for backup files rotation
aws s3api put-bucket-lifecycle-configuration --bucket my-bucket --life
cycle-configuration  file://lifecycle.json

Example of lifecycle.json which transition backups to s3 Glacier:

{
              "Rules": [
                  {
                      "ID": "Move rotated backups to Glacier",
                      "Prefix": "etcd-data/",
                      "Status": "Enabled",
                      "Transitions": [
                          {
                              "Date": "2015-11-10T00:00:00.000Z",
                              "StorageClass": "GLACIER"
                          }
                      ]
                  },
                  {
                      "Status": "Enabled",
                      "Prefix": "",
                      "NoncurrentVersionTransitions": [
                          {
                              "NoncurrentDays": 2,
                              "StorageClass": "GLACIER"
                          }
                      ],
                      "ID": "Move old versions to Glacier"
                  }
              ]
          }

Simplify etcd backup with Velero

Velero is powerful Kubernetes backup tool. It simplify many operation tasks.
As a result using Velero it’s easier to:

  • Choose what to backup(objects, volumes or everything)
  • Choose what NOT to backup(e.g. secrets)
  • Schedule cluster backups
  • Store backups on remote storage
  • Fast disaster recovery process

Install and configure Velero

1)Download latest version at Velero github page

2)Create AWS credential file:

[default]
aws_access_key_id=<your AWS access key ID>
aws_secret_access_key=<your AWS secret access key>

3)Create s3 bucket for etcd-backups

aws s3 mb s3://kubernetes-velero-backup-bucket

4)Install velero to kubernetes cluster:

velero install --provider aws --plugins velero/velero-plugin-for-aws:v1.0.0 --bucket kubernetes-velero-backup-bucket --secret-file ./aws-iam-creds --backup-location-config region=us-east-1 --snapshot-location-config region=us-east-1

Note: we use s3 plugin to access remote storage. Velero support many different storage providers. See which works for you best.

Schedule automated backups

1)Schedule daily backups:

velero schedule create <SCHEDULE NAME> --schedule "0 7 * * *"

2)Create a backup manually:

velero backup create <BACKUP NAME>

Disaster Recovery with Velero

Note: You might need to re-install Velero in case of full etcd data loss.

When Velero is up disaster recovery process are simple and straightforward:

1)Update your backup storage location to read-only mode

kubectl patch backupstoragelocation <STORAGE LOCATION NAME> \
    --namespace velero \
    --type merge \
    --patch '{"spec":{"accessMode":"ReadOnly"}}'

By default, <STORAGE LOCATION NAME> is expected to be named default, however the name can be changed by specifying --default-backup-storage-location on velero server.

2)Create a restore with your most recent Velero Backup:

velero restore create --from-backup <SCHEDULE NAME>-<TIMESTAMP>

3)When ready, revert your backup storage location to read-write mode:

kubectl patch backupstoragelocation <STORAGE LOCATION NAME> \
   --namespace velero \
   --type merge \
   --patch '{"spec":{"accessMode":"ReadWrite"}}'

Conclusions

  • Kubernetes cluster with infrequent change to API server is great choice for single control plane setup.
  • Frequent backups of etcd cluster will minimize time window of potential data loss.

Having fun with Kubernetes deployment

Install deployment

Install nginx 1.12.2 with 2 pods

If you need to have 2 pods from the start then it could be done in three easy steps:

  • Create deployment template with nginx version 1.12.2
  • Edit nginx.yaml to update replicas count.
  • Apply deployment template to Kubernetes cluster
# step 1
kubectl create  deployment nginx --save-config=true --image=nginx:1.12.2 --dry-run=client -o yaml > nginx.yaml
# step 2
edit nginx.yaml
# step 3
kubectl apply --record=true -f nginx.yaml

Notice use of --record=true to save the state of what caused the deployment change

Auto-scaling deployment

Deployments can be scaled manually or automatically. Let’s see how it could be done in few simple commands.

Scaling manually up to 4 pods

kubectl scale deployment nginx --replicas=4 --record=true

Scaling manually down to 2 pods

kubectl scale deployment nginx --replicas=2 --record=true

Automatically scale up and down

Automatically scale up to 4 pods and down to 2 pods based on cpu usage

kubectl autoscale deployment nginx --min=2 --max 4

You can adjust when to scale up/down using --cpu-percent(e.g. --cpu-percent=80) flag

Continue reading Having fun with Kubernetes deployment

How to check Kubernetes cluster health?

There are some essential tools to have a quick look at Kubernetes cluster health. Let’s review them here. As a result you would be able quickly tell if cluster has any obvious issues.

Install node problem detector

node-problem-detector aims to make various node problems visible to the upstream layers in cluster management stack. It is a daemon which runs on each node, detects node problems and reports them to apiserver.

kubectl apply -f https://k8s.io/examples/debug/node-problem-detector.yaml

Use node-problem detector in conjunction with drainer daemon. So, to quickly replace unhealthy nodes. Learn more about it at Monitor Node Health.

Kubernetes cluster info

To see if kubectl connect to master and master is running and on which port use kubectl cluster-info. To debug cluster state use kubectl cluster-info dump as a result it will print full cluster state including pod logs to stdout, but you can setup output to a directory.

kubectl cluster-info

Kubernetes master is running at https://10.0.0.10:6443
KubeDNS is running at https://10.0.0.10:6443/api/v1/namespaces/kube-system/services/kube-dns:dns/proxy
Metrics-server is running at https://10.0.0.10:6443/api/v1/namespaces/kube-system/services/https:metrics-server:/proxy

Nodes information

Get extended output of node information. Pay attention to STATUS, ROLES, AGE and IP columns. So, you see that ip addresses is the one which works in your network and able to communicate with each other. Also, nodes age is a kind of uptime for node, it could tell if nodes are stable enough – very useful if you use spot instances.

kubectl get nodes -o wide

NAME      STATUS   ROLES    AGE   VERSION   INTERNAL-IP   EXTERNAL-IP   OS-IMAGE             KERNEL-VERSION      CONTAINER-RUNTIME
master    Ready    master   11h   v1.18.2   10.0.0.10     <none>        Ubuntu 18.04.4 LTS   4.15.0-99-generic   docker://19.3.8
worker1   Ready    <none>   11h   v1.18.2   10.0.0.11     <none>        Ubuntu 18.04.4 LTS   4.15.0-99-generic   docker://19.3.8
worker2   Ready    <none>   11h   v1.18.2   10.0.0.12     <none>        Ubuntu 18.04.4 LTS   4.15.0-99-generic   docker://19.3.8

API Component statuses

Status of the most important component of Kubernetes cluster apart from apiserver could be retrieved using get componentstatusescommand.

kubectl get componentstatuses
NAME                 STATUS    MESSAGE             ERROR
scheduler            Healthy   ok                  
controller-manager   Healthy   ok                  
etcd-0               Healthy   {"health":"true"} 

Pods statuses

Checking for not running pods with extended output could help you understand if there are any commonalities between failed pods like they are all at the same node or they all are belong to same availability zone.

kubectl get pods -o wide --all-namespaces |grep -v " Running "

Retrieve cluster events

Check events from all namespaces sorted by timestamp. As a result you will see how the state of the cluster have been changed for past two hours. Events are stored only for two hours to prevent apiserver from disk overload.

kubectl get events --all-namespaces --sort-by=.metadata.creationTimestamp

Api server health

You can check api server health using healthz endpoint which return HTTPS status 200 and message ‘ok’ when it’s healthy. So, you can keep an eye on the pulse of the cluster using simple tools like pingdom or nagios.

curl -k https://api-server-ip:6443/healthz
ok