In this article I describe how to quickly get started with SLO and SLI practice using Istio. if you are new SLO and SLI read a Brief Summary of SRE best practices.
RED or Rate Errors Duration
The RED method is an easy to understand monitoring methodology. For every service, monitor:
Rate – how many operations per second is placed on a service
Errors – what percentage of the traffic return in error state
Duration – the time it take to serve a request or process a job
Rate, Errors, Duration are a good Service Level Indicators to start, because undesirable change in any of it directly impact your users.
Examples of Service Level Objectives for RED indicators:
- Number of Requests are above 1000 operations per minute or Number of Requests don’t drop more than on 10% for 10 minutes period
- Errors rate are below 0.5%
- Request Latency for 99% of operations are less than 100ms
For a microservices platform, RED is a perfect metrics to start with. But how to collect and visualize them for a big number of services?
Enter Istio.
Deploying Kubernetes, Istio and demo Apps
Tools for a demo
- minikube – local Kubernetes cluster to test our setup (optional if you have a demo cluster)
- skaffold – an application for building and deploying demo microservices
- istioctl – istio command line tool
- Online Boutique – a cloud-native microservices demo application
Kubernetes and Istio
For our demo we would need following cluster specs with default Istio setup.
minikube start --cpus=4 --memory 4096 --disk-size 32g
curl -L https://istio.io/downloadIstio | sh -
cd istio-1.6.4
bin/istioctl install --set profile=demo
kubectl label namespace default istio-injection=enabled
Demo applications
For test applications I am using Online Boutique which is cloud native microservices demo from Google Cloud Platform team.
git clone https://github.com/GoogleCloudPlatform/microservices-demo.git
cd microservices-demo
skaffold run # this will build and deploy applications. take about 20 minutes
Verify that applications are installed:
kubectl get pods
NAME                                     READY   STATUS    RESTARTS   AGE
adservice-85cb97f6c8-fkbf2               2/2     Running   0          96s
cartservice-6f955b89f4-tb6vg             2/2     Running   2          96s
checkoutservice-5856dcfdd5-s7phn         2/2     Running   0          96s
currencyservice-9c888cdbc-4lxhs          2/2     Running   0          96s
emailservice-6bb8bbc6f7-m5ldg            2/2     Running   0          96s
frontend-68646cffc4-n4jqj                2/2     Running   0          96s
loadgenerator-5f86f94b89-xc7hf           2/2     Running   3          95s
paymentservice-56ddc9454b-lrpsm          2/2     Running   0          95s
productcatalogservice-5dd6f89b89-bmnr4   2/2     Running   0          95s
recommendationservice-868bc84d65-cgj2j   2/2     Running   0          95s
redis-cart-b55b4cf66-t29mk               2/2     Running   0          95s
shippingservice-cd4c57b99-r8bl7          2/2     Running   0          95s
Notice 2/2 Ready containers. One of the container is Istio sidecar proxy which will do all the job for collecting RED metrics.
RED metrics Visualization
Setup a proxy to Grafana dashboard
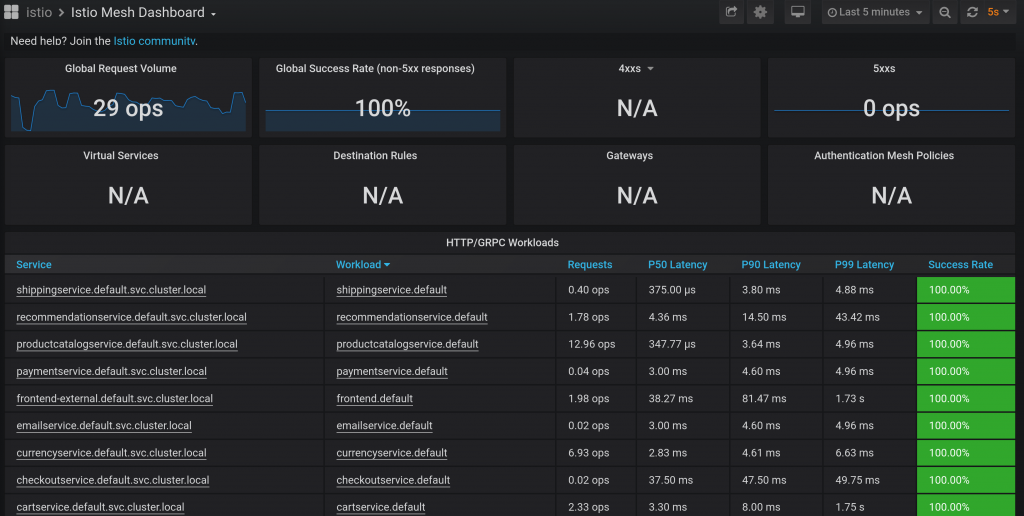
kubectl -n istio-system port-forward $(kubectl -n istio-system get pod -l app=grafana -o jsonpath='{.items[0].metadata.name}') 3000:3000 &Open Grafana Istio Service Mesh dashboard for a global look at RED metrics

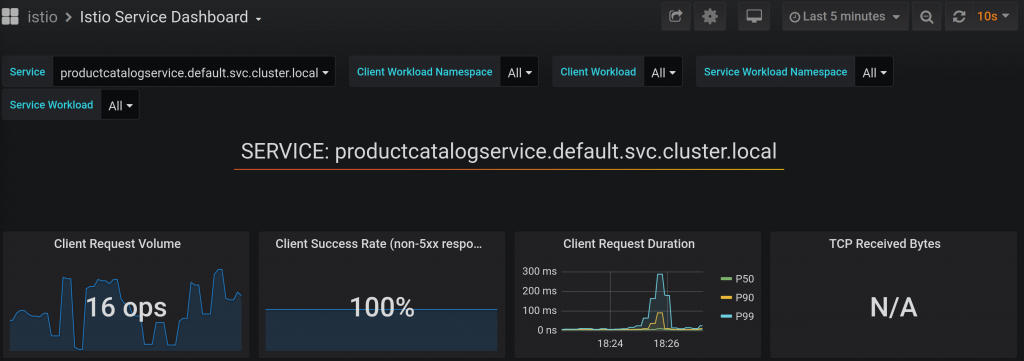
Detailed board for any service with RED metrics looks like:

Conclusions
Istio provide Rate, Errors and Duration metrics out of the box which is a big leap toward SLO and SLI practice for all services.
Incorporating Istio in your platform is a big toward observability, security and control of your service mesh.
