This is day 10 out of 100 Days of golang coding!
Idea for today is to build transparent http proxy with ability to filter traffic. As for a filter I will use user agent which is common practice to filter traffic.
So, for the task I have used two go modules: user_agent and goproxy:
go get github.com/mssola/user_agent
go get gopkg.in/elazarl/goproxy.v1
First I have to setup a proxy and set a decide which hosts I want to match:
proxy := goproxy.NewProxyHttpServer()
proxy.Verbose = true
proxy.OnRequest(goproxy.ReqHostMatches(regexp.MustCompile("^.*$"))).DoFunc(
// skipped function body for now
)
log.Fatal(http.ListenAndServe(":8080", proxy))
Regex “^.*$” is set to match all hosts.
Second I setup user agent parser and filter by bot and browser:
func(r *http.Request, ctx *goproxy.ProxyCtx) (*http.Request, *http.Response) {
  //parse user agent string
  ua := user_agent.New(r.UserAgent())
  bro_name, _ := ua.Browser()
  if ua.Bot() || bro_name == "curl" {
    return r, goproxy.NewResponse(r,
      goproxy.ContentTypeText, http.StatusForbidden,
      "Don't waste your time!")
  }
  return r, nil
}
That’s all for coding. Now take a look at test cases:
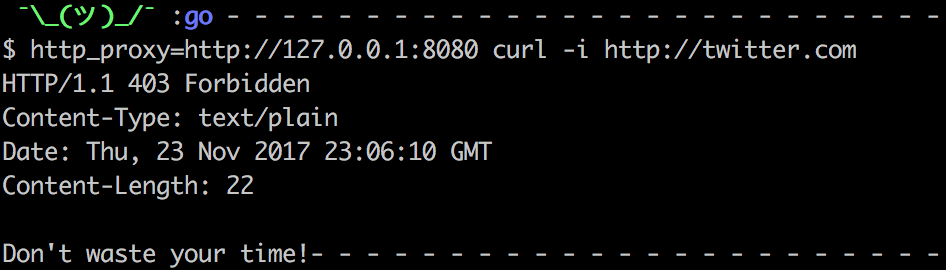
Use case 1 – curl command no user agent set
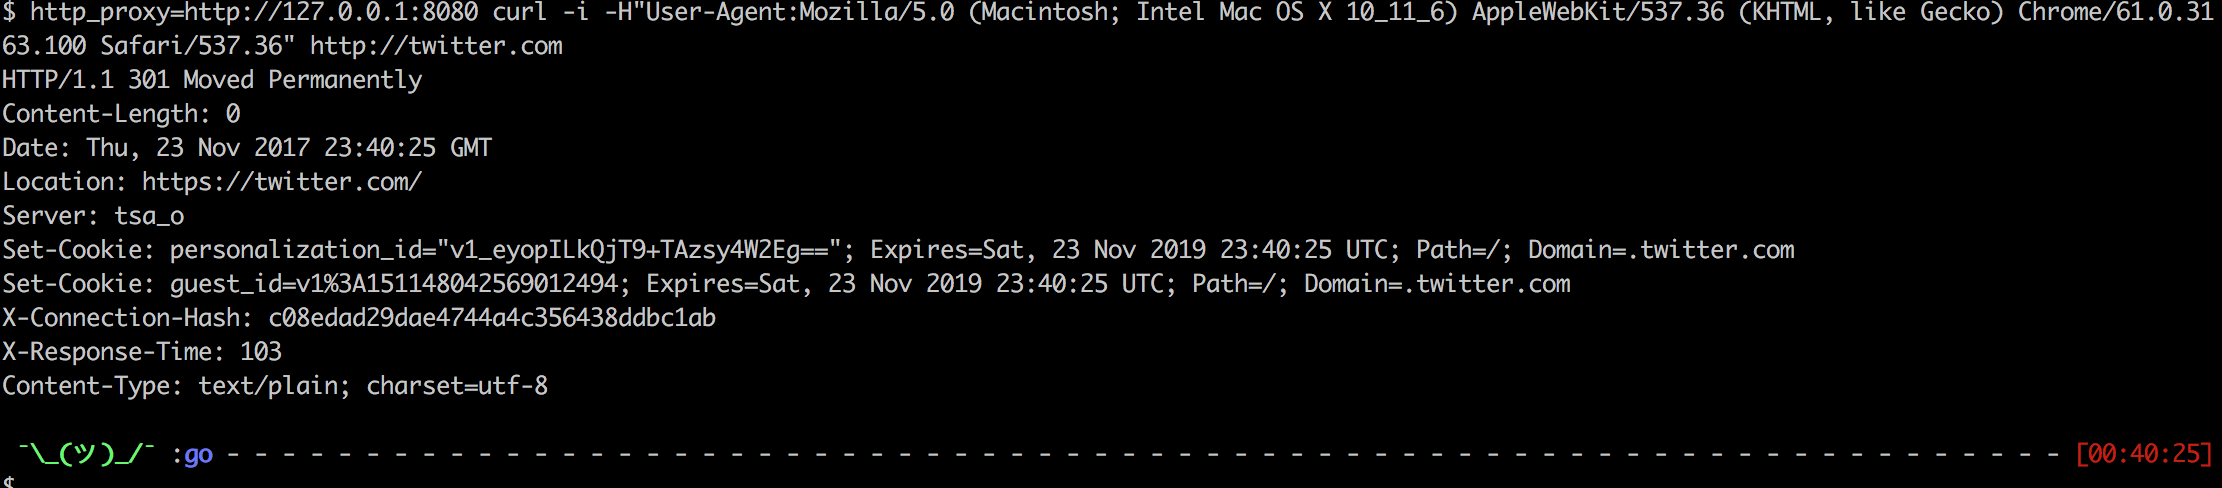
Use case 2 – curl with normal browser user agent
http_proxy=http://127.0.0.1:8080 curl -i -H"User-Agent:Mozilla/5.0 (Macintosh; Intel Mac OS X 10_11_6) AppleWebKit/537.36 (KHTML, like Gecko) Chrome/61.0.3163.100 Safari/537.36" http://twitter.com
In that case we have got requests from twitter server which was 301 to https.
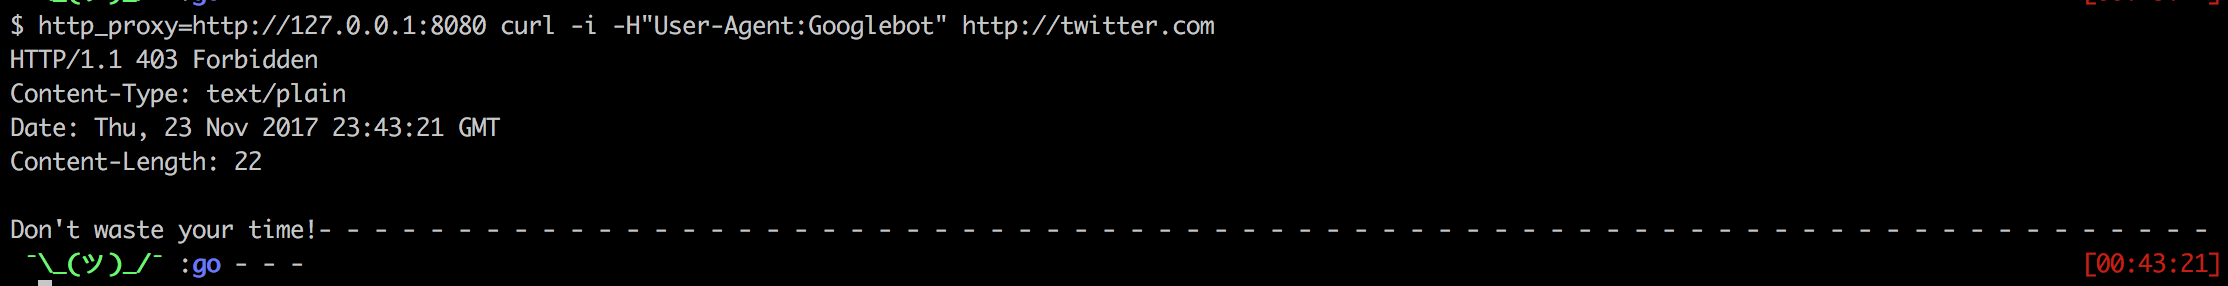
Use case 3 – curl with bot user agent
http_proxy=http://127.0.0.1:8080 curl -i -H"User-Agent:Googlebot" http://twitter.com
Full version of proxy with verbose information of user agent parsing:
package main

import (
	"fmt"
	"log"
	"net/http"
	"regexp"

	"github.com/mssola/user_agent"
	"gopkg.in/elazarl/goproxy.v1"
)

func main() {
	proxy := goproxy.NewProxyHttpServer()
	proxy.Verbose = true
	proxy.OnRequest(goproxy.ReqHostMatches(regexp.MustCompile("^.*$"))).DoFunc(
		func(r *http.Request, ctx *goproxy.ProxyCtx) (*http.Request, *http.Response) {
			//parse user agent string
			ua := user_agent.New(r.UserAgent())
			fmt.Printf("Is mobile: %v\n", ua.Mobile()) // => false
			fmt.Printf("Is bot: %v\n", ua.Bot())       // => false
			fmt.Printf("Mozilla: %v\n", ua.Mozilla())  // => "5.0"

			fmt.Printf("Platform: %v\n", ua.Platform()) // => "X11"
			fmt.Printf("OS: %v\n", ua.OS())             // => "Linux x86_64"

			nameE, versionE := ua.Engine()
			fmt.Printf("Engine: %v\n", nameE)            // => "AppleWebKit"
			fmt.Printf("Engine version: %v\n", versionE) // => "537.11"

			nameB, versionB := ua.Browser()
			fmt.Printf("Browser: %v\n", nameB)            // => "Chrome"
			fmt.Printf("Browser version: %v\n", versionB) // => "23.0.1271.97"

			if ua.Bot() || nameB == "curl" {
				return r, goproxy.NewResponse(r,
					goproxy.ContentTypeText, http.StatusForbidden,
					"Don't waste your time!")
			}
			return r, nil
		})
	log.Fatal(http.ListenAndServe(":8080", proxy))
}
Source code available at GitHub.