Kubernetes sidecar pattern: nginx ssl proxy for nodejs

I learn about sidecar pattern from Kubernetes documentation and later from blog post by Brendan Burns The distributed system toolkit. Sidecar is very useful pattern and work nice with Kubernetes.
In the tutorial I want to demonstrate how “legacy” application can be extend with https support by using  sidecar pattern based on Kubernetes.

Problem

We have legacy application which doesn’t have HTTPS support. We also don’t want to send plain text traffic over network. We don’t want to make any changes to legacy application, but good thing that it is containerised.

Solution

We will use sidecar pattern to add HTTPS support to “legacy” application.

Overview

Main application
For our example main application I will use Nodejs Hello World service (beh01der/web-service-dockerized-example)
Sidecar container 
To add https support I will use Nginx ssl proxy (ployst/nginx-ssl-proxy) container

Deployment

TLS/SSL keys
First we need to generate TLS certificate keys and add them to Kubernetes secrets. For that I am using script from nginx ssl proxy repository which combine all steps in one:
git clone https://github.com/ployst/docker-nginx-ssl-proxy.git
cd docker-nginx-ssl-proxy
./setup-certs.sh /path/to/certs/folder

Adding TLS files to Kubernetes secrets

cd /path/to/certs/folder
kubectl create secret generic ssl-key-secret --from-file=proxykey=proxykey --from-file=proxycert=proxycert --from-file=dhparam=dhparam

Kubernetes sidecar deployment

In following configuration I have defined main application container “nodejs-hello” and nginx container “nginx”. Both containers run in the same pod and share pod resources, so in that way implementing sidecar pattern. One thing you want to modify is hostname, I am using not existing hostname appname.example.com for this example.
apiVersion: apps/v1beta2
kind: Deployment
metadata:
  name: nodejs-hello
  labels:
    app: nodejs
    proxy: nginx
spec:
  replicas: 1
  selector:
    matchLabels:
      app: nodejs-hello
  template:
    metadata:
      labels:
        app: nodejs-hello
    spec:
      containers:
      - name: nodejs-hello
        image: beh01der/web-service-dockerized-example
        ports:
        - containerPort: 3000
      - name: nginx
        image: ployst/nginx-ssl-proxy
        env:
        - name: SERVER_NAME
          value: "appname.example.com"
        - name: ENABLE_SSL
          value: "true"
        - name: TARGET_SERVICE
          value: "localhost:3000"
        volumeMounts:
          - name: ssl-keys
            readOnly: true
            mountPath: "/etc/secrets"          
        ports:
        - containerPort: 80
          containerPort: 443
      volumes:
      - name: ssl-keys
        secret:
          secretName: ssl-key-secret

Save this file to deployment.yaml and create deployment Kubernetes object:

kubectl create -f deployment.yaml

Wait for pods to be Read:

kubectl get pods

NAME                            READY     STATUS    RESTARTS   AGE
nodejs-hello-686bbff8d7-42mcn   2/2       Running   0          1m

Testing

For testing I setup two port forwarding rules. First is for application port and second for nginx HTTPS port:

kubectl -n test port-forward <pod> 8043:443
#and in new terminal window run
kubectl -n test port-forward <pod> 8030:3000

First lets validate that application respond on http and doesn’t respond on https requests

#using http
curl -k -H "Host: appname.example.com" http://127.0.0.1:8030/ 
Hello World! 
I am undefined!

#now using https
curl -k -H "Host: appname.example.com" https://127.0.0.1:8030/ 
curl: (35) Server aborted the SSL handshake

Note: SSL handshake issue is expected as our “legacy” application doesn’t support https and even if it would it must serve https connection on different port than http. The test goal was to demonstrate the response.

Time to test connection through sidecar nginx ssl proxy

curl -k  -H "Host: appname.example.com" https://127.0.0.1:8043/
Hello World!
I am undefined!

Great! We have got expected output through https connection.

Conclusions

  • Nginx extended nodejs app with https support with zero changes to any of containers
  • Sidecar pattern modular structure provide great re-use of containers, so teams can be focused on application development
  • Ownership of containers can be split between teams as there is no dependency between containers
  • Scaling might not be very efficient, because sidecar container have to scale with main container

Continuous integration and deployment with Google Cloud Builder and Kubernetes

Pipeline of Continuous Integration(CI) for containers has several basic steps. Lets see what they are:

Setup a trigger

Listen to a change in repositories(github, bitbucket) such like pull request, new tag or new branch.

It is basic step for any CI/CD tool and for google cloud builder it is pretty trivial task to setup. Check out Container Registry – Build Triggers tool in google cloud console.

Build an image

When change to repository occur we want to start build of new Docker container image for a change. Good practice is to tag new image with branch name and git reference hash. E.g. master-00covfefe

With cloud builder you face two choices: use a Dockerfile or cloudbuild.yaml file. With Dockerfile option steps are predetermined and don’t give you too much flexibility.
With cloudbuild.yaml you can customise every step of your pipeline.
In the following example first command is doing a build step using Dockerfile and second command tag new image with branch-revision pattern(remember master-00covfefe):

steps:
- name: 'gcr.io/cloud-builders/docker'
  args: [ 'build', '-t', 'eu.gcr.io/$PROJECT_ID/my-nodejs-app', '.' ]

- name: 'gcr.io/cloud-builders/docker'
  args: [ 'tag', 'eu.gcr.io/$PROJECT_ID/my-nodejs-app', 'eu.gcr.io/$PROJECT_ID/my-nodejs-app:$BRANCH_NAME-$REVISION_ID']

Push new image to Container Registry

One important note that cloudbuild.yaml file has special directive “image” which publish image to registry, but that directive only executed at the end of all steps. So, in order to perform deployment step you need to publish image as a separate step.

- name: 'gcr.io/cloud-builders/docker'
  args: ['push', 'eu.gcr.io/$PROJECT_ID/my-nodejs-app:$BRANCH_NAME-$REVISION_ID']

Deploy new image to Kubernetes

When new image is in registry it’s time to trigger deployment step. In this example it is deployment to Kubernetes cluster.
This step require Google Cloud Builder user to have Edit permissions to kubernetes cluster. In google cloud it is a user with “@cloudbuild.gserviceaccount.com” domain. You need to give that user Edit access to kubernetes using IAM console.
Second requirement is to specify zone and cluster cloudbuild.yaml using env variables. That will tell kubectl command to which cluster to deploy.

- name: 'gcr.io/cloud-builders/kubectl'
  args: ['set', 'image', 'deployment/my-nodejs-app-deployment', 'my-nodejs-app=eu.gcr.io/$PROJECT_ID/my-nodejs-app:$BRANCH_NAME-$REVISION_ID']
  env:
  - 'CLOUDSDK_COMPUTE_ZONE=europe-west1-d'
  - 'CLOUDSDK_CONTAINER_CLUSTER=staging-cluster'

What next

At this point the CI/CD job is done. Possible next steps to improve your pipeline can be:

  1. Send notification to Slack or Hipchat to let everyone know about new version deployment.
  2. Run user acceptance tests to check that all functions perform well.
  3. Run load tests and stress tests to check that new version has no degradation in performance.

Full cloudbuild.yaml file example

steps:
#build steps
- name: 'gcr.io/cloud-builders/docker'
  args: [ 'build', '-t', 'eu.gcr.io/$PROJECT_ID/my-nodejs-app', '.' ]

- name: 'gcr.io/cloud-builders/docker'
  args: [ 'tag', 'eu.gcr.io/$PROJECT_ID/my-nodejs-app', 'eu.gcr.io/$PROJECT_ID/my-nodejs-app:$BRANCH_NAME-$REVISION_ID']

- name: 'gcr.io/cloud-builders/docker'
  args: ['push', 'eu.gcr.io/$PROJECT_ID/my-nodejs-app:$BRANCH_NAME-$REVISION_ID']

#deployment step
- name: 'gcr.io/cloud-builders/kubectl'
  args: ['set', 'image', 'deployment/my-nodejs-app-deployment', 'my-nodejs-app=eu.gcr.io/$PROJECT_ID/my-nodejs-app:$BRANCH_NAME-$REVISION_ID']
  env:
  - 'CLOUDSDK_COMPUTE_ZONE=europe-west1-d'
  - 'CLOUDSDK_CONTAINER_CLUSTER=staging-cluster'

#image update steps(two tags: latest and branch-revision)
images:
- 'eu.gcr.io/$PROJECT_ID/my-nodejs-app'
- 'eu.gcr.io/$PROJECT_ID/my-nodejs-app:$BRANCH_NAME-$REVISION_ID'

#tags for container builder
tags:
  - "frontend"
  - "nodejs"
  - "dev-team-1"

Prepare Application Launch Checklist

Introduction

Application Launch checklist is aimed for Devops, Sysops and anyone whois job to make website available and reliable.
The checklist better works for applications which are going to be Live in near feature, but also useful to validate your Devops processes for already running applications.

This checklist is a complied notes from Launch Checklist for Google Cloud Platform. It is mostly targeted on Devops work routines and in a nutshell explain first and necessary Devops steps into launching applications.

Software Architecture Documentation

  • Create an Architectural Summary. Include an overall architectural diagram, a summary of the process flows, detail the service interaction points.
  • List and describe how each service is used. Include use of any 3rd-party APIs.
  • Make it easy accessible and available – the best as wiki pages.

Builds and Releases

  • Document your build and release, configuration, and security management processes.
  • Automate build process. Include automated testing and packaging.
  • Automate release process to provision package between environments. Include rollback functionality.
  • Version your configuration and put it into Configuration Management system like Saltstack, Puppet or Ansible.
  • Simulate build and release failures. Are you able to roll back effectively? Is the process documented?

Disaster recovery

  • Document your routine backup, regular maintenance, and disaster recovery processes.
  • Test your restore process with real data. Determine time required for a full restore and reflect this in the disaster recovery processes.
  • Automate as much as possible.
  • Simulate major outages and test your Disaster Recovery processes
  • Simulate individual services failure to test your incidents recovery process

Monitoring

  • Document and define your system monitoring and alerting processes.
  • Validate that your system monitoring and alerting are sufficient and effective.

Final thoughts

I can not overstate how much final outcome depend on the level of interaction between Developers, Sysops and Devops teams in your organisation.
After application will go live convert it to a training program for every new devop before she will start site support.

Making simple Splunk Nginx dashboard

As a DevOps guy I often do incident analysis, post deployment monitoring and usual logs checks. If you also is using Splunk as me when let me show for you few effective Splunk commands for Nginx logs monitoring.

Extract fileds

To make commands works Nginx log fields have to be extracted into variables.
Where are 2 ways to extract fields:

  1. By default Splunk recognise “access_combined” log format which is default format for Nginx. If it is your case congratulations nothing to do for you!
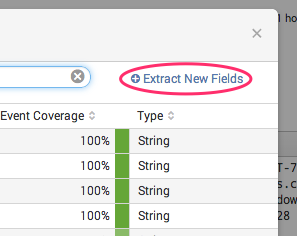
  2. For custom format of logs you will need to create regular expression. Splunk has built in user interface to extract fields or you can provide regular expression manually.

field_extractor

Website traffic over time and error rate

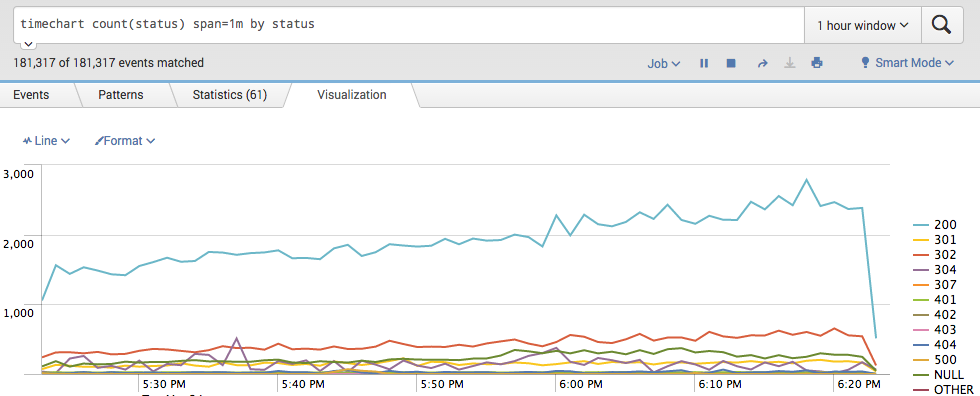
Unexpected spike in traffic or in error rate are always first thing to look for. Following command build a time chart with response codes. Codes 200/300 is your normal traffic and 400/500 is errors.

timechart count(status) span=1m by status

Website traffic in Splunk

Response time

How do you know if your website running slowly?
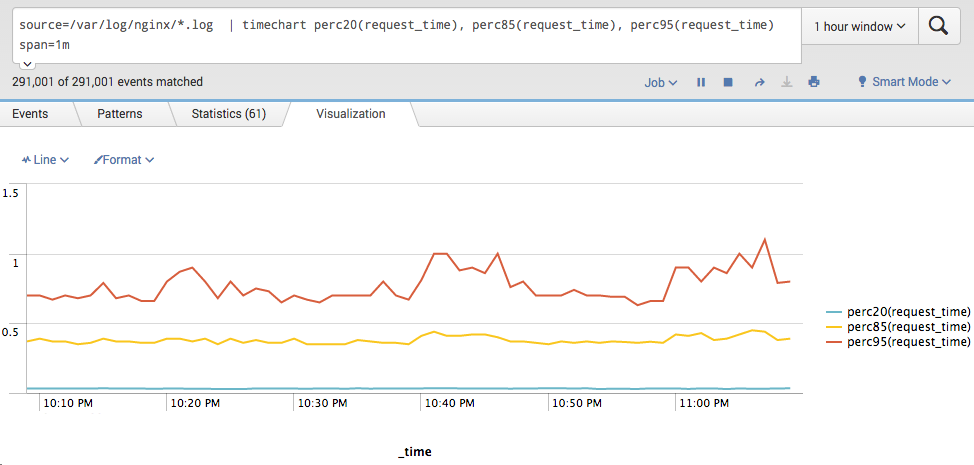
For response time I suggest to use 20, 85 and 95 percentile as metrics.
You also can think of average response time metric, but low average response time doesn’t show that website is OK, so I am not using that metric in the query.

timechart perc20(request_time), perc85(request_time), perc95(request_time) span=1m

Response time in Splunk

Traffic by IP

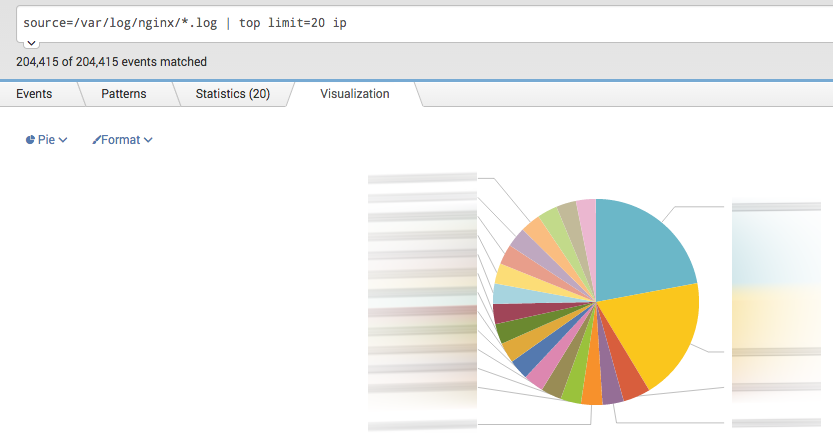
Checking which IPs are most popular is a good way to spot bad guys or misbehaving bot.

top limit=20 clientip

Traffic by IP with splunk

Top of error page

Looking for pages which produce most errors like 500 Internal Server Error or not found pages like 404? Following two queries give you exactly that information.
Top error pages

search status >= 500 | stats count(status) as cnt by uri, status | sort cnt desc

Top 40x error pages

search status >= 400 AND status < 500 | stats count(status) by uri, status | sort cnt desc

TOP nginx error urls with Splunk

Number of timeouts(>30s) per upstream

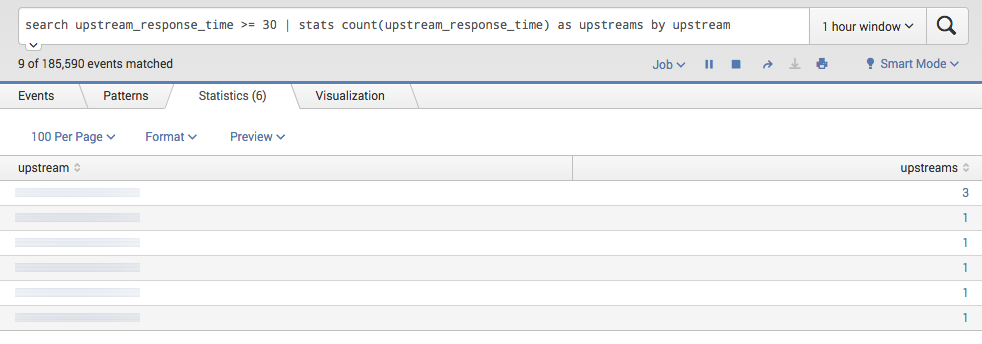
When you are using Nginx as a proxy server it is very useful to see if any of upstreams are getting timeouts.
Timeouts could be a symptom for: slow application performance, not enough system resources or just upstream server is down.

search upstream_response_time >= 30 | stats count(upstream_response_time) as upstreams by upstream

Splunk get timeout nginx upstreams

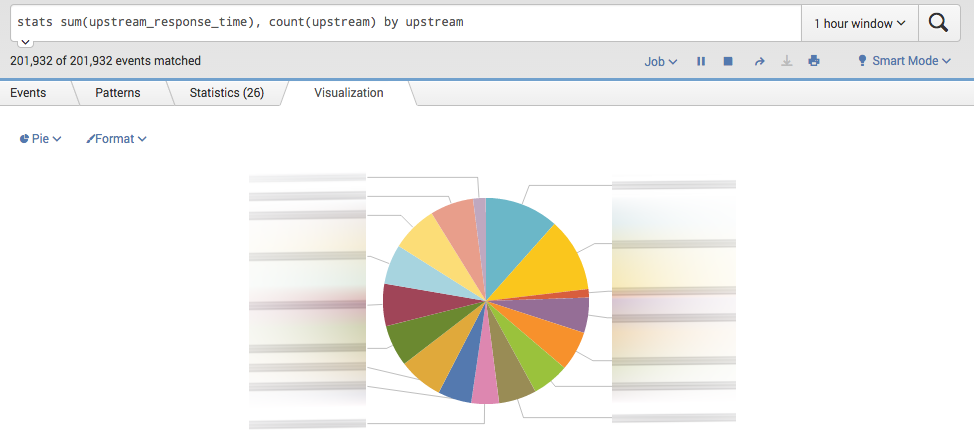
Most time consuming upstreams

Most time consuming upstreams showing which of servers are already overloaded by requests and giving you a hint when application needs to be scaled

stats sum(upstream_response_time), count(upstream) by upstream

Most time consuming upstreams

In conclusion

Splunk functions like timechart, stats and top is your best friends for data aggregation. They are like unix tools – the more tools you know the more easier is to build powerful commands.