Implementing RED method with Istio

In this article I describe how to quickly get started with SLO and SLI practice using Istio. if you are new SLO and SLI read a Brief Summary of SRE best practices.

RED or Rate Errors Duration

The RED method is an easy to understand monitoring methodology. For every service, monitor:

Rate – how many operations per second is placed on a service
Errors – what percentage of the traffic return in error state
Duration – the time it take to serve a request or process a job

Rate, Errors, Duration are a good Service Level Indicators to start, because undesirable change in any of it directly impact your users.
Examples of Service Level Objectives for RED indicators:

  • Number of Requests are above 1000 operations per minute or Number of Requests don’t drop more than on 10% for 10 minutes period
  • Errors rate are below 0.5%
  • Request Latency for 99% of operations are less than 100ms

For a microservices platform, RED is a perfect metrics to start with. But how to collect and visualize them for a big number of services?

Enter Istio.

Deploying Kubernetes, Istio and demo Apps

Tools for a demo

  • minikube – local Kubernetes cluster to test our setup (optional if you have a demo cluster)
  • skaffold – an application for building and deploying demo microservices
  • istioctl – istio command line tool
  • Online Boutique – a cloud-native microservices demo application

Kubernetes and Istio

For our demo we would need following cluster specs with default Istio setup.

minikube start --cpus=4 --memory 4096 --disk-size 32g
curl -L https://istio.io/downloadIstio | sh -
cd istio-1.6.4
bin/istioctl install --set profile=demo
kubectl label namespace default istio-injection=enabled

Demo applications

For test applications I am using Online Boutique which is cloud native microservices demo from Google Cloud Platform team.

git clone https://github.com/GoogleCloudPlatform/microservices-demo.git
cd microservices-demo
skaffold run # this will build and deploy applications. take about 20 minutes

Verify that applications are installed:

kubectl get pods
NAME                                     READY   STATUS    RESTARTS   AGE
adservice-85cb97f6c8-fkbf2               2/2     Running   0          96s
cartservice-6f955b89f4-tb6vg             2/2     Running   2          96s
checkoutservice-5856dcfdd5-s7phn         2/2     Running   0          96s
currencyservice-9c888cdbc-4lxhs          2/2     Running   0          96s
emailservice-6bb8bbc6f7-m5ldg            2/2     Running   0          96s
frontend-68646cffc4-n4jqj                2/2     Running   0          96s
loadgenerator-5f86f94b89-xc7hf           2/2     Running   3          95s
paymentservice-56ddc9454b-lrpsm          2/2     Running   0          95s
productcatalogservice-5dd6f89b89-bmnr4   2/2     Running   0          95s
recommendationservice-868bc84d65-cgj2j   2/2     Running   0          95s
redis-cart-b55b4cf66-t29mk               2/2     Running   0          95s
shippingservice-cd4c57b99-r8bl7          2/2     Running   0          95s

Notice 2/2 Ready containers. One of the container is Istio sidecar proxy which will do all the job for collecting RED metrics.

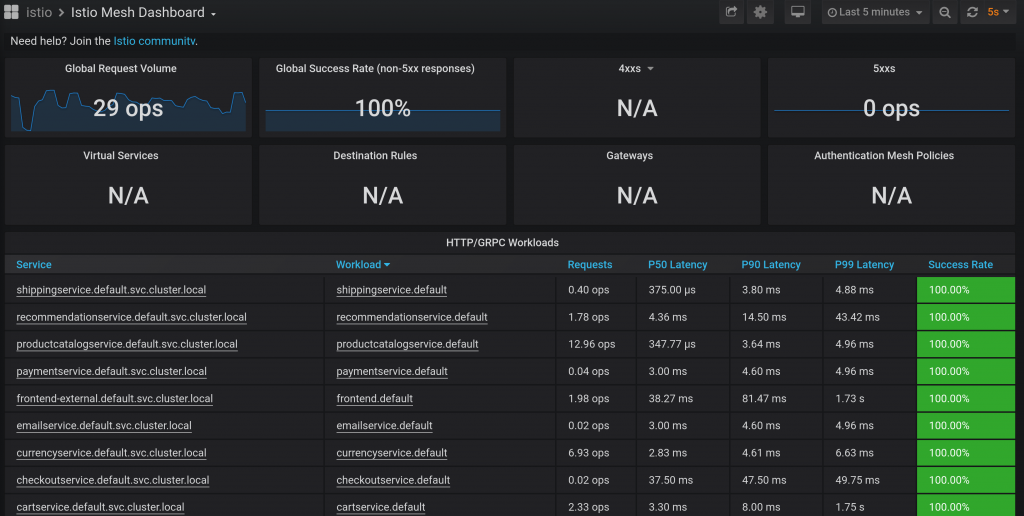
RED metrics Visualization

Setup a proxy to Grafana dashboard

kubectl -n istio-system port-forward $(kubectl -n istio-system get pod -l app=grafana -o jsonpath='{.items[0].metadata.name}') 3000:3000 &

Open Grafana Istio Service Mesh dashboard for a global look at RED metrics

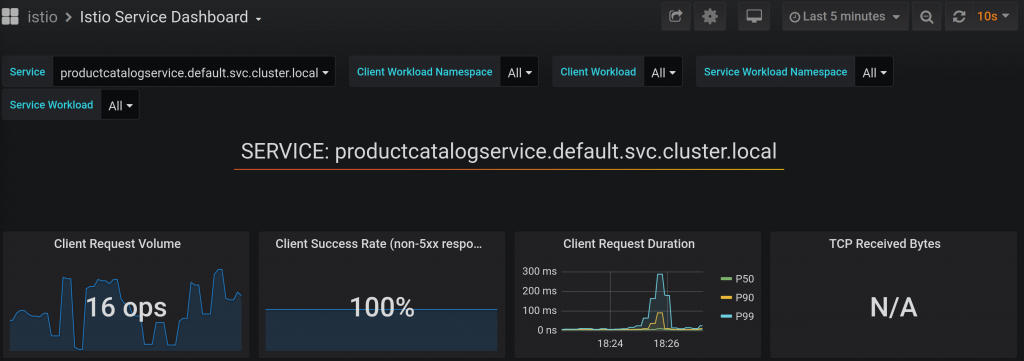
Detailed board for any service with RED metrics looks like:

Conclusions

Istio provide Rate, Errors and Duration metrics out of the box which is a big leap toward SLO and SLI practice for all services.

Incorporating Istio in your platform is a big toward observability, security and control of your service mesh.

Brief Summary of Site Reliability Engineering best practices

The goal of SRE is to accelerate product development teams and keep services running in reliable and continuous way.

This article is a collection practical notes on explaining what is SRE, what kind of work SREs does and what type of processes they develop. The practices are based on Google SRE workbook.

This is a long article and If you will make it to the end I applaud to you!

But, don’t stop here, go and read both Google SRE books which mentioned in References. Then learn about Prometheus and ELK stacks – they are open source tools that help to implement SRE practices.
That should keep your busy for at least a year. I wish you best of luck!

SRE practices include

  • SLOs and SLIs
  • Monitoring
  • Alerting
  • Toil reduction
  • Simplicity

SLO and SLI

SLO is Service Level Objective is a goal that service provider wants to reach.

Practicality of SLO: SLOs are tools to help determine what engineering work to prioritize. SLOs define the concept of error budget.

Talking about error budget, lets see next how error budget have to be approached.

Error budget approach

  • There are SLOs which all stakeholder in org. approved
  • It is possible to meet SLOs needs under normal conditions
  • Org. is committed to using error budget for decision making and prioritizing

This are essentials steps to have error budget approach in place, your work is to go as close as possible to fulfill them.

What to measure using SLIs

SLIs is the ration between two numbers: the good and the total:

  • Number of successful HTTP request / total HTTP requests
  • Number of consumed jobs in a queue / total number of jobs in a queue

SLI divided on specification and implementation. For example:

  • Specification: ration of requests loaded in < 100 ms
  • Implementation based on: a) server logs b) Javascript on client

SLO and SLI in practice

The strategy to implement SLO, SLI in your company is to start small. Consider following aspects when working on your first SLO.

  • Choose one application for which you want to define SLOs
  • Decide on few keys SLIs specs that matter to your service and users
  • Consider common ways and tasks through which your users interact with service
  • Draw a high-level architecture diagram of your system
  • Show key components. The requests flow. The data flow

The result is narrow and focused prove of concept that would help to make benefits of SLO, SLI concise and clear.

Type of SLIs

SLI is Service Level Indicator is a measurement the service provider uses for the SLO goal.

There are several types of measurement you might choose from depend on type of your service:

  • Availability – The proportion of request which result in successful state
  • Latency – The proportion of request below some time threshold
  • Freshness – The proportion of data transferred to some time threshold. Replication or Data pipeline
  • Correctness – The proportion of input that produce correct output
  • Durability – The proportion of records written that can be successfully read

Summary of first actions toward SLOs and SLIs

  • Setup white box monitoring: prometheus, datadog, newrelic
  • Develop key SLOs and SLOs response process like incident management
  • Error budget enforcement decisions. Written error budget policy. Priority to reliability when error budget is spent.
  • Continuous improvement of SLOs target. Monthly SLOs review.
  • Count outages and measure user happiness
  • Create a training program to train developers on SLOs and other reliability concepts
  • Create SLOs dashboard

This is essential starting points to implement SLOs in your company. It will bring more confidence and better decision making in your services.

Monitoring

How SRE define monitoring

  • Alert on condition that require attention
  • Investigate and diagnose issues
  • Display information about the system visually
  • Gain insight into system health and resource usage for long-term planning
  • Compare the behavior of the system before and after a change, or between two control groups

Features of monitoring you have to know and tune

  • Speed. Freshness of data.
  • Data retention and calculations
  • Interfaces: graphs, tables, charts. High level or low level.
  • Alerts: multiple categories, notifications flow, suppress functionality.

Source of monitoring

  • Metrics
  • Logs

That is high level overview. Details depend on your tools and platform. For the ones who are only starting I recommend to look for open source projects such as Prometheus, Grafana and ElasticSearch(ELK) monitoring stack.

Alerting

Alerting considerations

  • Precision – The proportion of events detected that were significant
  • Recall – The proportion of significant events detected
  • Detection time – How long it takes to send notification in various conditions
  • Reset time – How long alerts fire after an issue is resolved

Ways to alerts

There are several strategies on how alerts could be setup. Recommendation is to combine several strategies to enhance your alerts quality from different directions.

First and simple one:

  • Target error rate ≥ SLO threshold.
    • Example: For 10 minutes window error rate exceeds the SLO
    • Upsides: Fast recall time
    • Downsides: Precision is low
  • Increased alert windows.
    • Example: if an event consumes 5% of the 30-day error budget – a 36-hour window.
    • Upsides: good detection time
    • Downside: poor reset time
  • Increment alert duration. For how long alert should be triggered to be significant.
    • Upsides: Alerts can be higher precision.
    • Downside: poor recall and poor detection time
  • Alert on burn rate. How fast, relative to SLO, the service consume error budget.
    • Example: 5% error budget over 1 hour period.
    • Upside: Good precision, short time window, good detection time.
    • Downside: low recall, long reset time
  • Multiple burn rate alerts. Depend on burn rate determine severity of alert which lead to page notification or a ticket
    • Upsides: good recall, good precision
    • Downsides: More parameters to manage, long reset time
  • Multi window, multi burn alerts.
    • Upsides: Flexible alert framework, good precision, good recall
    • Downside: even more harder to manage, lots of parameters to specify

The same as for Monitoring an open source tool to be alert on metrics is combination of Prometheus and Alertmanager. As for logs look for Kibana project which has Alerting on log patterns.

Toil reduction

Definition: toils is repetitive, predictable, constant stream of tasks related to maintaining a service

What is toil

  • Manual. When the tmp directory on a web server reach 95% utilization, you need to login and find a space to clean up
  • Repetitive. A full tmp director is unlikely to be a one time event
  • Automatable. If the instructions are well defined then it’s better to automate the problem detection and remediation
  • Reactive. When you receive too many alerts of “disks full”, they distract more than help. So, potentially high-severity alerts could be missed
  • Lacks enduring value. The satisfaction of completed tasks is short term, because it is to prevent the issue in the future
  • Grow at least as fast as it’s source. Growing popularity of the service will require more infrastructure and more toil work

Potential benefits of toil automation

  • Engineering work might reduce toil in the future
  • Increased team morale
  • Less context switching for interrupts, which raises team productivity
  • Increased process clarity and standardization
  • Enhanced technical skills
  • Reduced training time
  • Fewer outages attributable to human errors
  • Improved security
  • Shorter response times for user requests

How to measure toil

  • Identify it.
  • Measure the amount of human effort applied to this toil
  • Track these measurements before, during and after toil reduction efforts

Toil categorization

  • Business processes. Most common source of toil.
  • Production interrupts. The key tasks to keep system running.
  • Product releases. Depending on the tooling and release size they could generate toil.(release requests, rollbacks, hot fixes and repetitive manual configuration changes)
  • Migrations. Large scale migration or even small database structure change likely done manually as one time effort. Such thinking is a mistake, because this work is repetitive.
  • Cost engineering and capacity planning. Ensure a cost-effective baseline. Prepare for critical high traffic events.
  • Troubleshooting

Toil management strategies in practices

Basics:

  • Identify and measure
  • Engineer toil out of the system
  • Reject the toil
  • Use SLO to reduce toil

Organizational:

  • Start with human-backed interfaces. For complex business problems start with partially automated approach.
  • Get support from management and colleagues. Toil reduction is worthwhile goal.
  • Promote toil reduction as a feature. Create strong business case for toil reduction.
  • Start small and then improve

Standardization and automation:

  • Increase uniformity. Lean to standard tools, equipment and processes.
  • Access risk within automation. Automation with admin-level privileges should have safety mechanism which checks automation actions against the system. It will prevent outages caused by bugs in automation tools.
  • Automate toil response. Think how to approach toil automation. It shouldn’t eliminate human understanding of what’s going on.
  • Use open source and third-party tools.

In general:

  • Use feedback to improve. Seek for feedback from users who interact with your tools, workflows and automation.

Simplicity

Measure complexity

  • Training time. How long it take for newcomer engineer to get on full speed.
  • Explanation time. The time it takes to provide a view on system internals.
  • Administrative diversity. How many ways are there to configure similar settings
  • Diversity of deployed configuration
  • Age. How old is the system

SRE work on simplicity

  • SRE understand the systems end to prevent and fix source of complexity
  • SRE should be involved in design, system architecture, configuration, deployment processes, or elsewhere.
  • SRE leadership empower SRE teams to push for simplicity, and to explicitly reward these efforts.

Conclusions

  • SRE practices require significant amount of time and skilled SRE people to implement right
  • A lot of tools are involved in day to day SRE work
  • SRE processes is one of a key to success of tech company

References

Integrating Flask with Jaeger tracing on Kuberentes

Distributed applications and microservices required high level of observability. In this article we will integrate a Flask micro framework with Jaeger tracing tool. All code will be deployed to Kubernetes minikube cluster.

Flask

Let’s build a simple task manager service using Flask framework.

Code

tasks.py

from flask import Flask, jsonify
app = Flask(__name__)

@app.route('/')

tasks = {"tasks":[
        {"name":"task 1", "uri":"/task1"},
        {"name":"task 2", "uri":"/task2"}
    ]}

def  root():
	"Service root"
	return  jsonify({"url":"/tasks")
                     
@app.route('/tasks')
def  tasks():
	"Tasks list"
	return  jsonify(tasks)

if __name__ == '__main__':
  "Start up"
  app.run(debug=True, host='0.0.0.0',port=5000)
Continue reading Integrating Flask with Jaeger tracing on Kuberentes

Terraform remote state and state locking

Terraform remote state and state locking is important part in team collaboration. What are challenges when working on Terraform in a team:
1. how to synchronize terraform state between people
2. how to avoid collisions of running terraform at the same time

Terraform remote state

Terraform remote state is a mechanism to share state file by hosting it on a shared resource like aws s3 bucket or consul server.

Example of storing state in s3 bucket.

terraform {
  backend "s3" {
    bucket         = "mybucket-terraform-state-file"
    key            = "example/terraform.tfstate"
    region         = "us-east-1"
    encrypt        = true
  }
}

Bucket have to be created beforehand. You the key to separate states from difference modules and projects.

Terraform state locking

Terraform locking state isolate state changes. As soon as lock is acquired by terraform plan or apply no other terraform plan/apply command will succeed until lock is released.

To store lock in dynamodb table you need:
– Create dynamodb table in your aws account in the same region as specified in your terramform backend configuration (us-east-1 in our case)
– primary key must have a name LockID without it locking will not work

terraform {
  backend "s3" {
    bucket         = "mybucket-terraform-state-file"
    key            = "example/terraform.tfstate"
    region         = "us-east-1"
    encrypt        = true
    dynamodb_table = "terraform_example_lock"
  }
}

Note that terraform provide a way to disable locking from command line using -lock=false flag, but it is not recommended.

One improvement is to set “key” keyword as variable and base it on module or project, so you don’t have to set it manually. One caveat with that approach is to make sure they key is unique across projects.

Best,
Iaroslav

AWS best practices for Lambda functions in Production

Hey folks,

just a month ago I have been involved in AWS project based on Lambda functions. In this article I will explain what I learned so far and how to create production Lambda AWS environment with best practices in mind.

I will start from top level and will explain everything you need to have basic infrastructure supporting your Lambda functions and other applications in your cloud.

VPC

First, you need to created dedicated VPC and reserve range of IPs which doesn’t conflict with your other networks in case you would need to pair them together. As a general rule you should never use default VPC for production needs.
Create a security group which only allow 80 and 443 incoming traffic.

Subnets

You would need at least 4 subnets, two private and two public. Each type of subnet have to split in at least two different availability zones.
Public subnet have to contain AWS services endpoints and your servers which needs to have direct connection to internet like ELB, API gateway endpoints or bastion host (your ssh jump server).
Private subnet have to contain all your infrastructure servers like web servers, database server or backend applications.

Note that You should never place your infrastructure servers in public subnets.

Internet gateway and NAT

To function properly your VPC have to be attached to internet gateway and your private subnet should have NAT service enabled.

MySQL

For the database I use MySQL RDS. You need to disable public access to the instance and deploy it into private subnet. In security group add port 3306 for incoming connections and only from internal IP range. So, we have double protection here with security group and internal dns name for database.
There are a lot of best practices of how to setup production ready mysql instance, so I will skip most of it, but what you definitely need is to have read replica and shadow copy enabled. Make sure you set maintenance window which is right for you.

Lambda functions

To have access to our private database Lambda functions needs to be deployed inside the same VPC in private subnets. To setup https endpoints for lambda functions you would need to attach API gateway. In Lambda security groups add ports 80 and 443 for incoming connections.

That’s pretty much it, but very often you will have other web applications running in your vpc and to route traffic properly between Lambda and other apps you would need some web proxy like nginx.

Nginx

To have common entry point for your web applications and Lambda function Nginx is the best way to go. There is a new possibility to use ELB for that, but it isn’t good enough yet.

To have reliable and secure setup of nginx you would need to use common pattern of AWS which include: ELB, Autoscaling group, Launch configuration and security groups.

On the configuration side nginx will proxy traffic to Lambda functions through API gateway.

Elastic load balancer

Here you need to decide what kind of ELB suits your needs. I choose ELB with HTTPS support which provide SSL termination.  In the ELB security group I added ports 80 and 443 for all incoming traffic.

Launch configuration

Within Launch configuration you need to define what kind of instance you want to launch when autoscaling is trigger in.

Autoscaling group

ASG define what is desired number of instance you want to run at any given moment. Using metrics such as CPU you can setup it to scale up or down to desired maximum or minimum number of instances.

Almost there!

Last step is to connect ELB with ASG and with Launch configuration!

Note I have skipped setting up of Target group and health checks, but they are pretty much basics.

That’s it!

Now you have a good start to develop with AWS Lambda in conjunction with general approach of web tier architecture.

What’s next?

Second part of the topic is to setup CI and automation. Next time I will write how to code infrastructure with terraform, create nginx image with packer and run configuration management with ansible.